

Weaker-than-expected operational performance: Can AST SpaceMobile stock hold support?

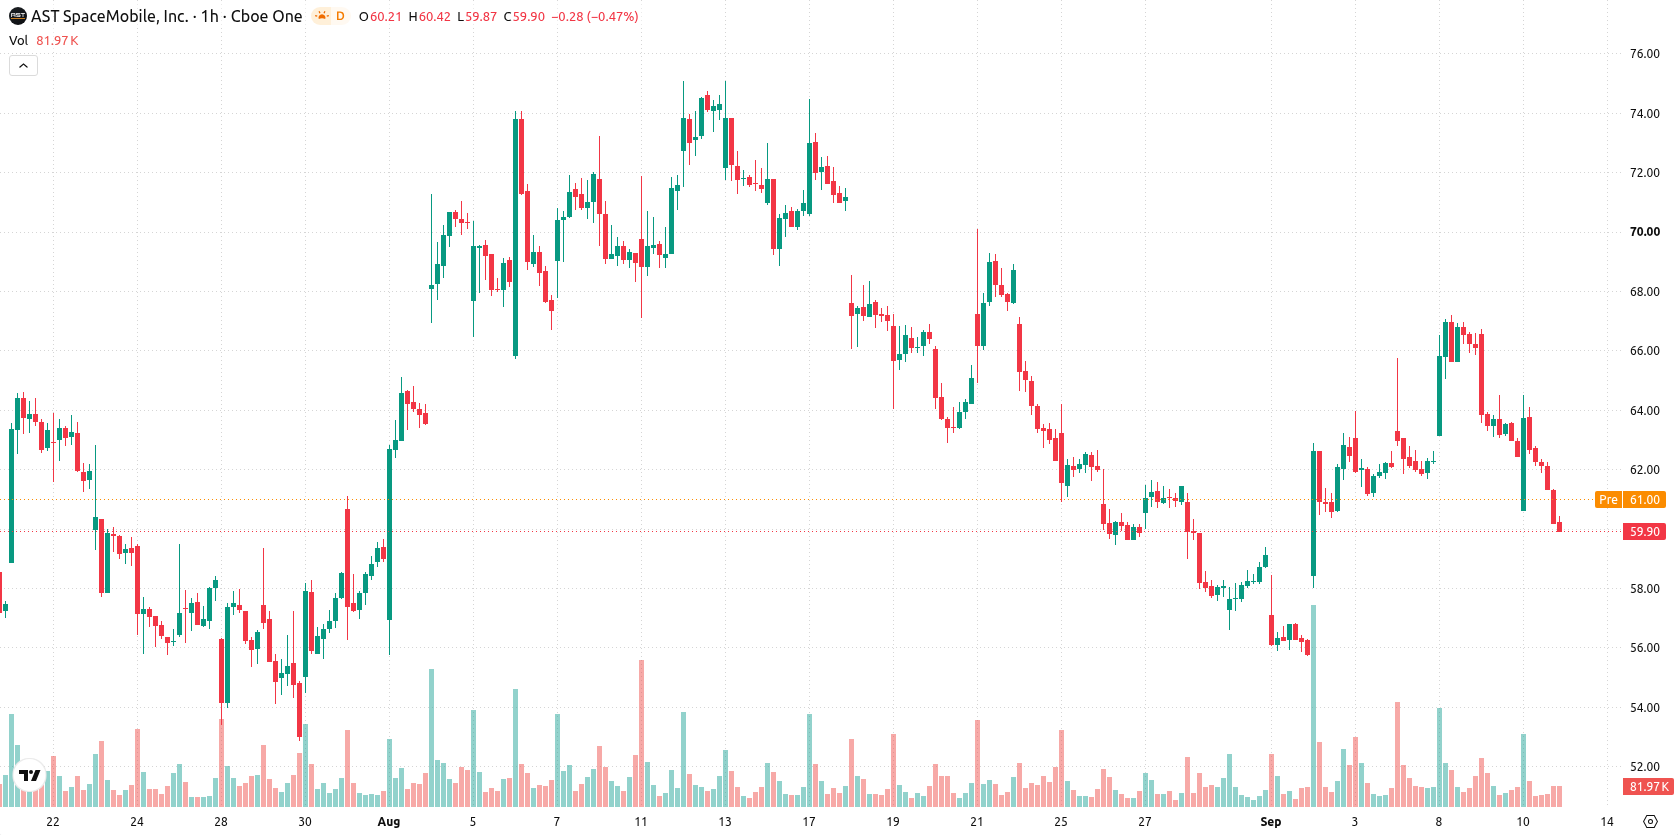
AST SpaceMobile (ASTS) stock is trading at $59.91 after falling 4.18% on the day. The current price sits below its key moving averages, highlighting ongoing weakness relative to recent trading benchmarks.
 34.27
38.11
Highlights
- AST SpaceMobile reported second quarter 2026 revenue and earnings below expectations, which is driving a negative market reaction.
- The company had $2.29 billion in cash and cash equivalents and $2.96 billion in long-term debt at the end of June 2026.
- Shares of AST SpaceMobile trade below key moving averages and momentum signals indicate strong bearish pressure, with the next 2 to 3 day price range expected between $56.36 and $63.15.
Earnings miss pressures sentiment as leverage concerns resurface
AST SpaceMobile reported second quarter 2026 results that missed both revenue and earnings expectations, which weighed on market sentiment. According to Congress, the company held $2.29 billion in cash and cash equivalents while shouldering $2.96 billion in long-term debt at the end of June 2026, outlining its liquidity position and leverage profile. The earnings shortfall serves as the primary catalyst for today's negative tone, with financial structure data providing important context for risk assessment.
Technical downtrend confirmed as sellers dominate key indicators
ASTS is trading below the MA-20 ($63.7) and MA-50 ($61.89) on the hourly chart, and also remains under the MA-200 ($81.51) on the daily timeframe. The Ichimoku Kijun on the daily chart acts as immediate resistance at $63.54. MACD and ADX continue to show sell signals, while momentum indicators such as RSI (35.09), Stoch RSI, CCI, and Bull/Bear Power reflect oversold conditions and persistent seller control. The Awesome Oscillator also echoes this bearish momentum, and the price action remains volatile, having dropped sharply intraday and now holding near session lows.
Downside risk persists as volatility constrains short-term upside
Over the next two to three sessions, ASTS is likely to trade within a volatility band between $56.36 and $63.15. The probability of a meaningful upward reversal is assessed as very low, with downside risk remaining high. A sideways trading scenario within this range is the baseline expectation, while a decisive move above $63.54 would be needed to establish a short-term bullish case. Conversely, a break below $56.36 support could accelerate additional declines.
Earlier, analysts noted that AST SpaceMobile was exhibiting persistent technical weakness and sustained downside risk. The latest earnings miss and continued bearish indicators reinforce this view, with traders advised to monitor the $56.36 support for signs of further deterioration.






Latest AST SpaceMobile News



-
 Afghanistan
-
 Albania
-
 Algeria
-
 Angola
-
 Argentina
-
 Armenia
-
 Australia
-
 Austria
-
 Azerbaijan
-
 Bahamas
-
 Bahrain
-
 Bangladesh
-
 Belarus
-
 Belgium
-
 Bolivia
-
 Botswana
-
 Brazil
-
 Brunei
-
 Bulgaria
-
 Cambodia
-
 Cameroon
-
 Canada
-
 Chile
-
 China
-
 Colombia
-
 Congo
-
 Costa Rica
-
 Cote d'Ivoire
-
 Croatia
-
 Cuba
-
 Cyprus
-
 Czechia
-
 DR Congo
-
 Denmark
-
 Dominican Republic
-
 Ecuador
-
 Egypt
-
 El Salvador
-
 Estonia
-
 Eswatini
-
 Ethiopia
-
 Finland
-
 France
-
 Georgia
-
 Germany
-
 Ghana
-
 Greece
-
 Haiti
-
 Hong Kong
-
 Hungary
-
 India
-
 Indonesia
-
 Iran, Islamic republic
-
 Iraq
-
 Ireland
-
 Israel
-
 Italy
-
 Jamaica
-
 Japan
-
 Jordan
-
 Kazakhstan
-
 Kenya
-
 Korea
-
 Kuwait
-
 Kyrgyzstan
-
 Laos
-
 Latvia
-
 Lebanon
-
 Lesotho
-
 Libya
-
 Lithuania
-
 Luxembourg
-
 Madagascar
-
 Malaysia
-
 Malta
-
 Mauritius
-
 Mexico
-
 Moldova
-
 Mongolia
-
 Montenegro
-
 Morocco
-
 Mozambique
-
 Myanmar
-
 Namibia
-
 Nepal
-
 Netherlands
-
 New Zealand
-
 Nigeria
-
 North Macedonia
-
 Norway
-
 Oman
-
 Pakistan
-
 Palestine
-
 Panama
-
 Papua New Guinea
-
 Paraguay
-
 Peru
-
 Philippines
-
 Poland
-
 Portugal
-
 Puerto Rico
-
 Qatar
-
 Reunion
-
 Romania
-
 Rwanda
-
 Saudi Arabia
-
 Serbia
-
 Singapore
-
 Slovakia
-
 Slovenia
-
 Somalia
-
 South Africa
-
 Spain
-
 Sri Lanka
-
 Sweden
-
 Switzerland
-
 Syria
-
 Taiwan
-
 Tajikistan
-
 Tanzania
-
 Thailand
-
 Trinidad and Tobago
-
 Tunisia
-
 Turkey
-
 UAE
-
 Uganda
-
 Ukraine
-
 United Kingdom
-
United States
-
 Uruguay
-
 Uzbekistan
-
 Venezuela
-
 Vietnam
-
 Yemen
-
 Zambia
-
 Zimbabwe
- Forex
- Crypto












