

Goldman Sachs Communacopia + Technology Conference presentation lifts T-Mobile stock toward $187.24 resistance

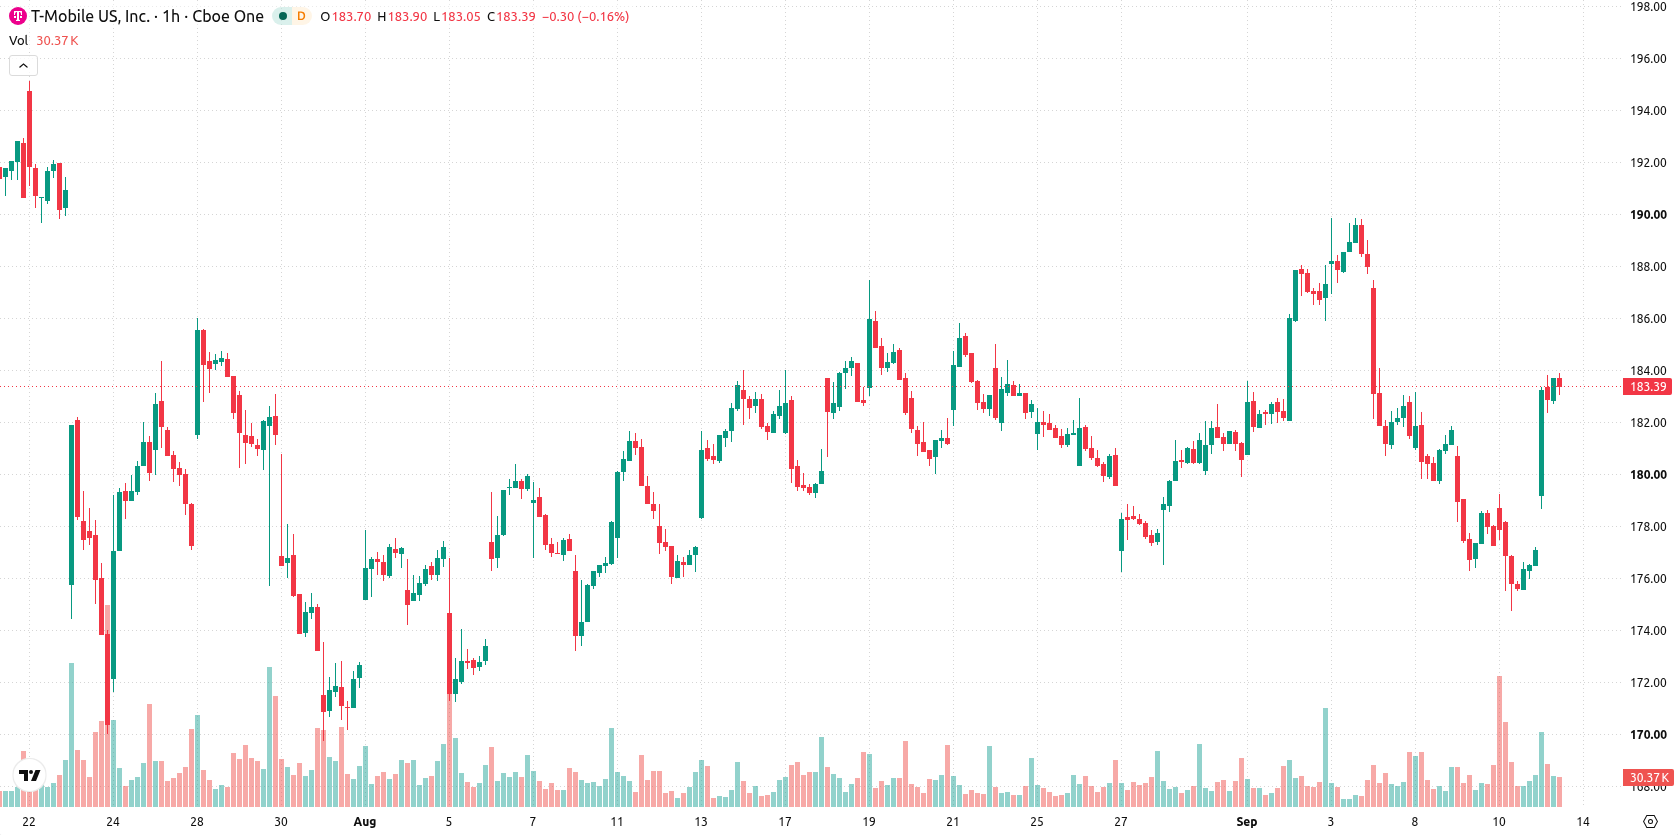
T-Mobile US, Inc. (TMUS) stock is trading at $183.64, marking a daily gain of 3.68%. The price currently sits above its key short- and medium-term moving averages while remaining below longer-term benchmarks.
 165.42
174.45
Highlights
- T-Mobile US management engaged institutional investors at the Goldman Sachs Communacopia + Technology Conference 2026, providing updates on financial targets and strategy.
- Conference appearances by T-Mobile US can amplify institutional attention and drive increased trading activity in the stock.
- Shares of T-Mobile US rose 3.68% and are expected to trade between $180.04 and $187.24, with technicals indicating upward short-term momentum but long-term weakness.
Investor attention rises as strategic plans outlined at conference
T-Mobile US, Inc. held a presentation at the Goldman Sachs Communacopia + Technology Conference 2026 on September 10, 2026, engaging institutional investors and analysts in an influential forum, according to Seekingalpha. Such conference appearances often serve as key venues for management to share financial targets or update strategic plans, enhancing short-term investor attention. The platform can catalyze renewed interest from large market participants and contribute to momentum observed in TMUS trading today.
Bullish price action diverges from weak underlying momentum signals
On the technical front, TMUS is trading above its MA-20 and MA-50 on the hourly chart, but remains below the MA-200 on the daily timeframe. The Ichimoku Kijun at $178.96 marks immediate support. Momentum indicators are mixed: MACD and ADX show downward pressure, while RSI and CCI are in sell territory, and Stoch RSI flags an overbought condition. Meanwhile, Bull/Bear Power continues to signal intraday seller dominance, and the Awesome Oscillator is neutral. Overall, today's price action has diverged from underlying momentum and oscillator signals, revealing a disconnect between bullish movement and technical trend strength.
Outlook favors consolidation as breakout depends on resistance test
In the near term, TMUS is expected to consolidate within the $180.04 to $187.24 range, reflecting typical volatility relative to current levels. The probability of a continued advance stands at 70%, with a 30% chance of a pullback, making further declines less likely in the short term. A bullish breakout scenario would require a clear move above resistance, whereas a drop below immediate support could trigger a more pronounced downside move.
Earlier, analysts noted that T-Mobile faced technical headwinds amid strategic shifts and activist pressure, with short-term momentum conflicting with longer-term weakness. The current technical setup adds a new layer by highlighting mixed momentum signals despite a strong advance, making sustained movement above $187.24 the key development to monitor for a potential bullish continuation.






Latest T-Mobile News



-
 Afghanistan
-
 Albania
-
 Algeria
-
 Angola
-
 Argentina
-
 Armenia
-
 Australia
-
 Austria
-
 Azerbaijan
-
 Bahamas
-
 Bahrain
-
 Bangladesh
-
 Belarus
-
 Belgium
-
 Bolivia
-
 Botswana
-
 Brazil
-
 Brunei
-
 Bulgaria
-
 Cambodia
-
 Cameroon
-
 Canada
-
 Chile
-
 China
-
 Colombia
-
 Congo
-
 Costa Rica
-
 Cote d'Ivoire
-
 Croatia
-
 Cuba
-
 Cyprus
-
 Czechia
-
 DR Congo
-
 Denmark
-
 Dominican Republic
-
 Ecuador
-
 Egypt
-
 El Salvador
-
 Estonia
-
 Eswatini
-
 Ethiopia
-
 Finland
-
 France
-
 Georgia
-
 Germany
-
 Ghana
-
 Greece
-
 Haiti
-
 Hong Kong
-
 Hungary
-
 India
-
 Indonesia
-
 Iran, Islamic republic
-
 Iraq
-
 Ireland
-
 Israel
-
 Italy
-
 Jamaica
-
 Japan
-
 Jordan
-
 Kazakhstan
-
 Kenya
-
 Korea
-
 Kuwait
-
 Kyrgyzstan
-
 Laos
-
 Latvia
-
 Lebanon
-
 Lesotho
-
 Libya
-
 Lithuania
-
 Luxembourg
-
 Madagascar
-
 Malaysia
-
 Malta
-
 Mauritius
-
 Mexico
-
 Moldova
-
 Mongolia
-
 Montenegro
-
 Morocco
-
 Mozambique
-
 Myanmar
-
 Namibia
-
 Nepal
-
 Netherlands
-
 New Zealand
-
 Nigeria
-
 North Macedonia
-
 Norway
-
 Oman
-
 Pakistan
-
 Palestine
-
 Panama
-
 Papua New Guinea
-
 Paraguay
-
 Peru
-
 Philippines
-
 Poland
-
 Portugal
-
 Puerto Rico
-
 Qatar
-
 Reunion
-
 Romania
-
 Rwanda
-
 Saudi Arabia
-
 Serbia
-
 Singapore
-
 Slovakia
-
 Slovenia
-
 Somalia
-
 South Africa
-
 Spain
-
 Sri Lanka
-
 Sweden
-
 Switzerland
-
 Syria
-
 Taiwan
-
 Tajikistan
-
 Tanzania
-
 Thailand
-
 Trinidad and Tobago
-
 Tunisia
-
 Turkey
-
 UAE
-
 Uganda
-
 Ukraine
-
 United Kingdom
-
United States
-
 Uruguay
-
 Uzbekistan
-
 Venezuela
-
 Vietnam
-
 Yemen
-
 Zambia
-
 Zimbabwe
- Forex
- Crypto












