


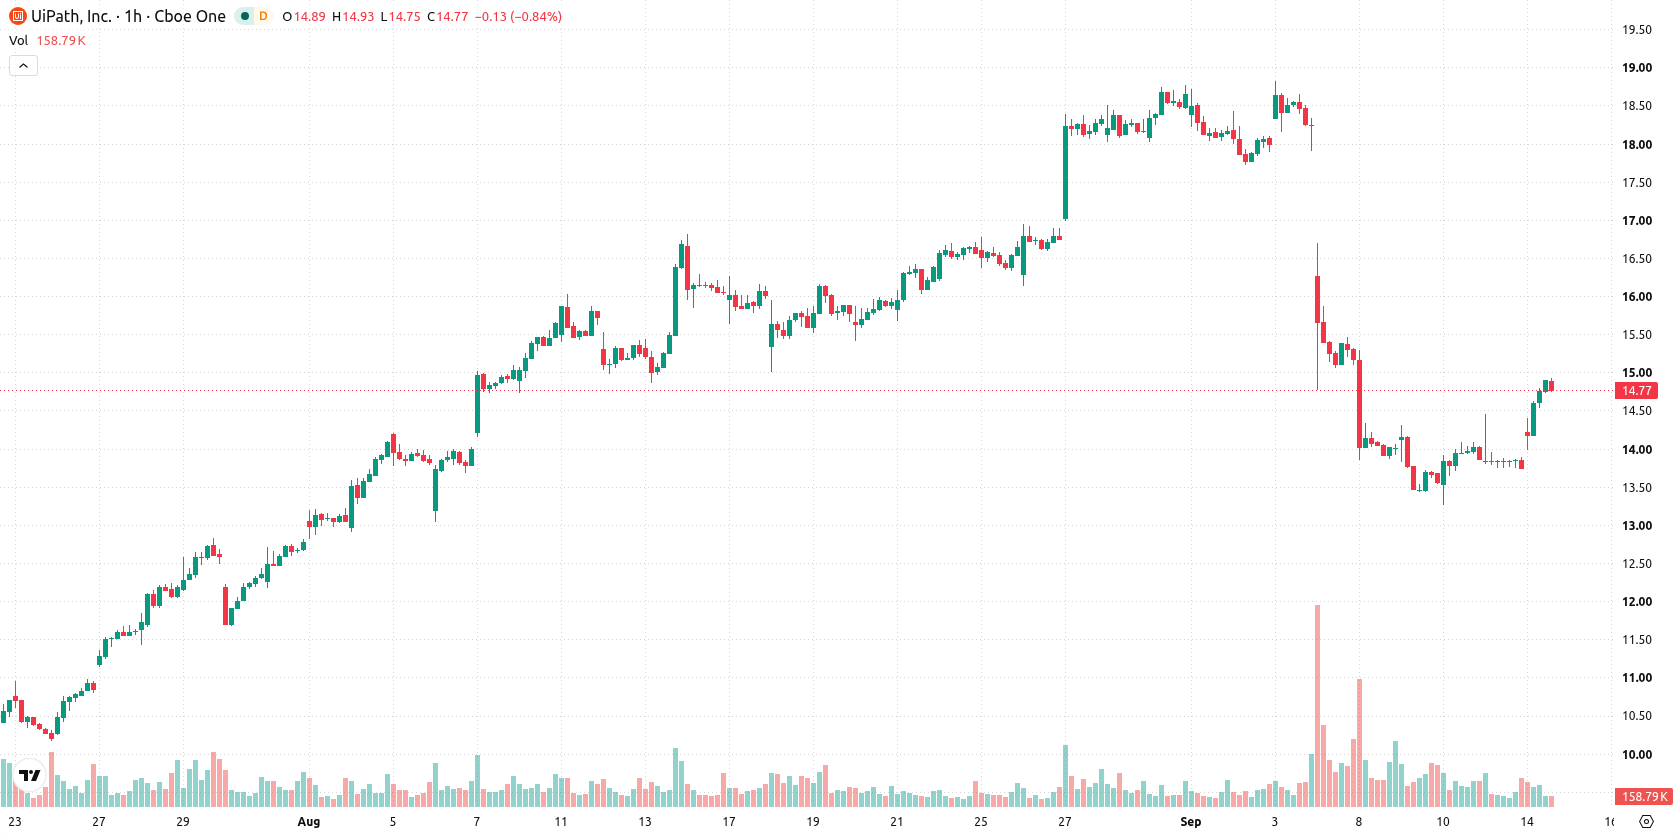
UiPath (PATH) stock is trading at $14.71, up 6.98% on the day and maintaining short-term momentum above its key short-term average, though still facing resistance from longer-term trends. The price remains above its primary long-term average, reflecting underlying support.
 13.41
13.41
Highlights
- UiPath has been recognized as a Leader in the 2026 Gartner Magic Quadrant for Intelligent Document Processing for a second consecutive year.
- The company reported positive GAAP and non-GAAP operating income for Q2 FY27 and raised guidance for revenue and annual recurring revenue.
- Shares of UiPath have surged 6.98% to $14.71 with mixed momentum signals and are expected to trade between $13.9 and $15.63 in the near term.
Profit outlook and institutional interest rise on strong guidance, external validation
UiPath has been recognized for the second year in a row as a Leader in the 2026 Gartner Magic Quadrant for Intelligent Document Processing, highlighting its technological leadership and broadening its appeal among enterprise clients, according to Blockonomi. This external validation supports stronger demand for its automation and document solutions, providing a catalyst for institutional interest. Additionally, UiPath reported positive GAAP and non-GAAP operating income for Q2 FY27 and raised guidance for both revenue and annual recurring revenue, pointing to improving profitability and building confidence in its growth trajectory.
Mixed technical indicators as path tests support with overbought signals
On the technical front, PATH is trading above its MA-20 but remains below the MA-50 on the working timeframe, while holding above the MA-200. The Ichimoku Kijun currently marks support at $13.95. Momentum indicators are mixed: RSI signals a Buy and ADX confirms active buyers, while MACD provides a Strong Sell signal. Stochastic RSI, CCI, and Bull/Bear Power all point to overbought conditions and dominant buyer pressure in intraday action. The Awesome Oscillator also affirms strong short-term bullish momentum, although diverging signals from oscillators highlight areas of caution.
Volatility band narrows as short-term bias leans toward pullback risk
In the near term, price action is likely to fluctuate between $13.9 and $15.63, reflecting the prevailing volatility band relative to current levels. With estimated odds of 48% for further upside and 52% for a reversal, the short-term scenario is balanced slightly in favor of a corrective pullback. If consolidation occurs above current support, price could stabilize within this corridor; a break above resistance would indicate renewed bullish momentum, while a breach of support at $13.95 could trigger an accelerated downside move.
Earlier, analysts noted that UiPath continued to face technical resistance and near-term consolidation pressures despite strong fundamentals. With recent technical signals remaining mixed amid fresh operational improvements and industry accolades, traders should monitor for a sustained move beyond the current consolidation band to clarify the next directional move.






Latest UiPath News




-
 Afghanistan
-
 Albania
-
 Algeria
-
 Angola
-
 Argentina
-
 Armenia
-
 Australia
-
 Austria
-
 Azerbaijan
-
 Bahamas
-
 Bahrain
-
 Bangladesh
-
 Belarus
-
 Belgium
-
 Bolivia
-
 Botswana
-
 Brazil
-
 Brunei
-
 Bulgaria
-
 Cambodia
-
 Cameroon
-
 Canada
-
 Chile
-
 China
-
 Colombia
-
 Congo
-
 Costa Rica
-
 Cote d'Ivoire
-
 Croatia
-
 Cuba
-
 Cyprus
-
 Czechia
-
 DR Congo
-
 Denmark
-
 Dominican Republic
-
 Ecuador
-
 Egypt
-
 El Salvador
-
 Estonia
-
 Eswatini
-
 Ethiopia
-
 Finland
-
 France
-
 Georgia
-
 Germany
-
 Ghana
-
 Greece
-
 Haiti
-
 Hong Kong
-
 Hungary
-
 India
-
 Indonesia
-
 Iran, Islamic republic
-
 Iraq
-
 Ireland
-
 Israel
-
 Italy
-
 Jamaica
-
 Japan
-
 Jordan
-
 Kazakhstan
-
 Kenya
-
 Korea
-
 Kuwait
-
 Kyrgyzstan
-
 Laos
-
 Latvia
-
 Lebanon
-
 Lesotho
-
 Libya
-
 Lithuania
-
 Luxembourg
-
 Madagascar
-
 Malaysia
-
 Malta
-
 Mauritius
-
 Mexico
-
 Moldova
-
 Mongolia
-
 Montenegro
-
 Morocco
-
 Mozambique
-
 Myanmar
-
 Namibia
-
 Nepal
-
 Netherlands
-
 New Zealand
-
 Nigeria
-
 North Macedonia
-
 Norway
-
 Oman
-
 Pakistan
-
 Palestine
-
 Panama
-
 Papua New Guinea
-
 Paraguay
-
 Peru
-
 Philippines
-
 Poland
-
 Portugal
-
 Puerto Rico
-
 Qatar
-
 Reunion
-
 Romania
-
 Rwanda
-
 Saudi Arabia
-
 Serbia
-
 Singapore
-
 Slovakia
-
 Slovenia
-
 Somalia
-
 South Africa
-
 Spain
-
 Sri Lanka
-
 Sweden
-
 Switzerland
-
 Syria
-
 Taiwan
-
 Tajikistan
-
 Tanzania
-
 Thailand
-
 Trinidad and Tobago
-
 Tunisia
-
 Turkey
-
 UAE
-
 Uganda
-
 Ukraine
-
 United Kingdom
-
United States
-
 Uruguay
-
 Uzbekistan
-
 Venezuela
-
 Vietnam
-
 Yemen
-
 Zambia
-
 Zimbabwe
- Forex
- Crypto












