


The Mosaic Company (MOS) slid 2.95% as the stock faced pressure after its latest earnings report and dividend announcement, with the company posting multi-billion dollar revenue and a positive net profit for the first half of 2026. The move is supported by near-term bearish technical signals, as the price is now consolidating toward key support despite a generally bullish trend structure.
 22.80
22.80
Highlights
- The Mosaic Company reported multi-billion dollar revenue and positive net profit for the first half of 2026, with regular dividends maintained.
- A quarterly dividend of $0.22 per share was declared, giving an annualized payout of $0.88 and yield of 3.5%.
- Mosaic stock trades in a short-term uptrend above key moving averages, with an expected range of $23.71 to $25.68 over the next five days.
Dividend sustainability and earnings beat fail to offset selling pressure
The Mosaic Company reported multi-billion dollar revenue and a positive net profit for the first half of 2026, maintaining its regular dividend distribution to shareholders for fiscal 2026. The company's latest quarterly earnings were accompanied by an announced dividend payout of $0.22 per share, equating to an annualized dividend of $0.88 and a yield of 3.5%. This reporting period has concluded, though price action has remained under broader selling pressure.
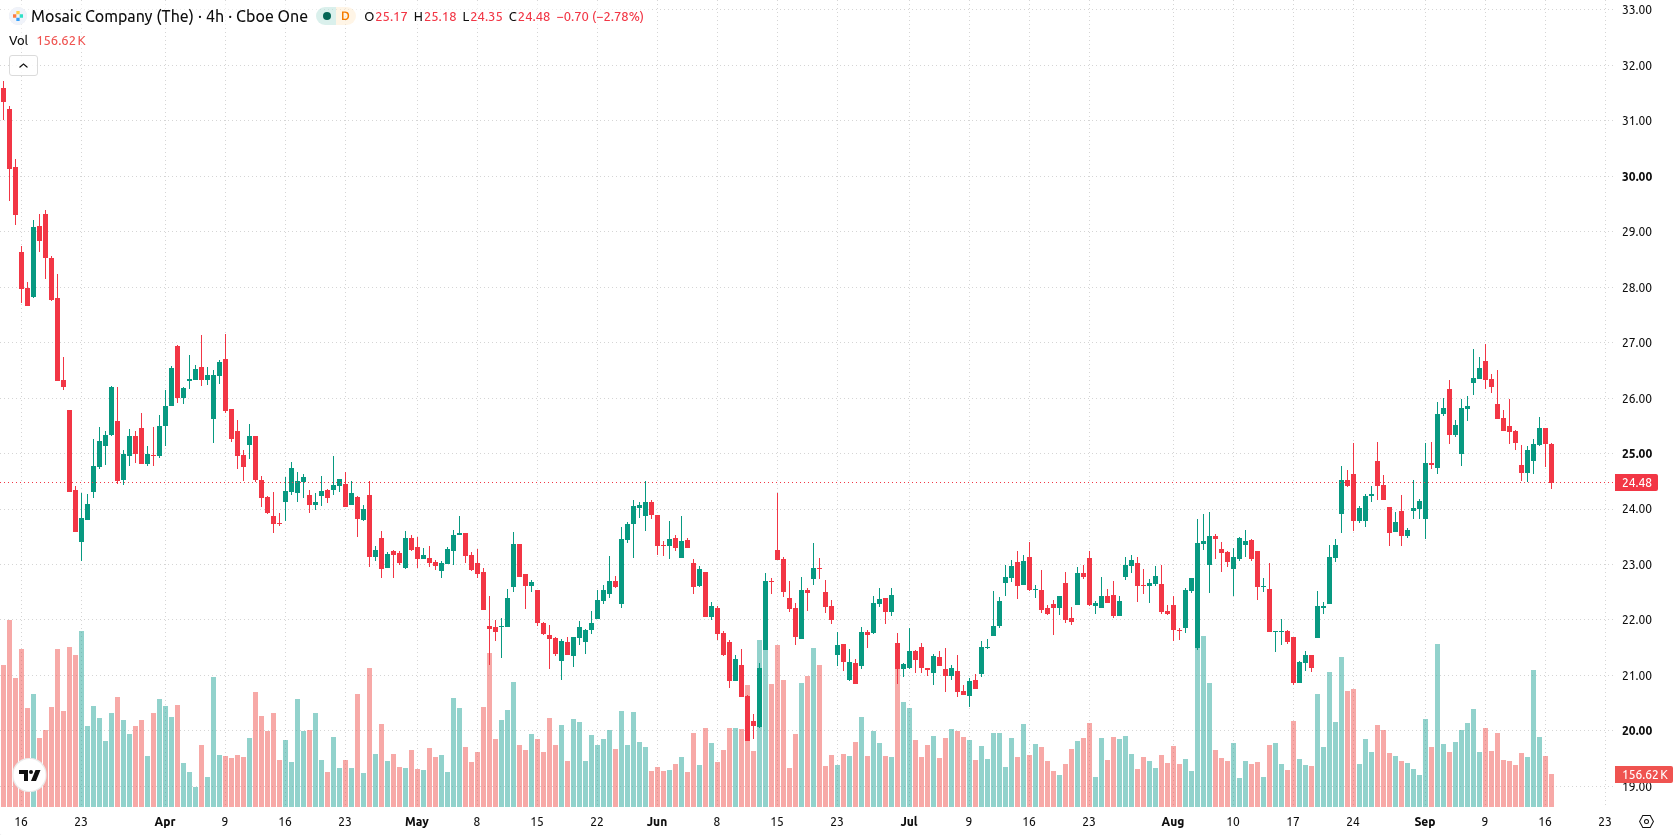
Bullish momentum tempered by resistance as neutral oscillators emerge
Mosaic is trading above its 20-day, 50-day, and 200-day moving averages at $24.54, $23.22, and $24.56 respectively, indicating support for the current uptrend in the short, medium, and long term. The near-term ceiling is at $24.77, serving as immediate resistance, while the near-term floor is $24.56; the MA-50 vs MA-200 alignment signals a bearish longer-term trend bias. Momentum signals are led by strong bullish readings from both MACD and Average Directional Index (ADX), with Relative Strength Index (RSI) at 59.14 and Stochastic RSI still low at 24.11, suggesting conditions are supportive of further upside but not yet overbought. Commodity Channel Index (CCI) and Awesome Oscillator (AO) remain neutral, while Bull/Bear Power (BBP) shows buyers dominate short-term momentum, yet also notes an overbought condition. The stock is currently down $0.75 or 2.95%, following a downside gap of about $0.08 (-0.31%), trading near the day’s low, and intraday volatility stands at 2.42%. Intraday tone suggests some pressure after the open with price action consolidating towards the session’s lower boundary, in line with the short-term momentum signals.
Earlier, analysts noted that Mosaic was demonstrating sustained technical strength driven by institutional accumulation, though with caution due to overbought conditions. The latest price action and short-term indicators suggest traders should closely watch the $24.56 support level as a break below it could signal increased downside risk within the coming sessions.






Latest The Mosaic Company News




-
 Afghanistan
-
 Albania
-
 Algeria
-
 Angola
-
 Argentina
-
 Armenia
-
 Australia
-
 Austria
-
 Azerbaijan
-
 Bahamas
-
 Bahrain
-
 Bangladesh
-
 Belarus
-
 Belgium
-
 Bolivia
-
 Botswana
-
 Brazil
-
 Brunei
-
 Bulgaria
-
 Cambodia
-
 Cameroon
-
 Canada
-
 Chile
-
 China
-
 Colombia
-
 Congo
-
 Costa Rica
-
 Cote d'Ivoire
-
 Croatia
-
 Cuba
-
 Cyprus
-
 Czechia
-
 DR Congo
-
 Denmark
-
 Dominican Republic
-
 Ecuador
-
 Egypt
-
 El Salvador
-
 Estonia
-
 Eswatini
-
 Ethiopia
-
 Finland
-
 France
-
 Georgia
-
 Germany
-
 Ghana
-
 Greece
-
 Haiti
-
 Hong Kong
-
 Hungary
-
 India
-
 Indonesia
-
 Iran, Islamic republic
-
 Iraq
-
 Ireland
-
 Israel
-
 Italy
-
 Jamaica
-
 Japan
-
 Jordan
-
 Kazakhstan
-
 Kenya
-
 Korea
-
 Kuwait
-
 Kyrgyzstan
-
 Laos
-
 Latvia
-
 Lebanon
-
 Lesotho
-
 Libya
-
 Lithuania
-
 Luxembourg
-
 Madagascar
-
 Malaysia
-
 Malta
-
 Mauritius
-
 Mexico
-
 Moldova
-
 Mongolia
-
 Montenegro
-
 Morocco
-
 Mozambique
-
 Myanmar
-
 Namibia
-
 Nepal
-
 Netherlands
-
 New Zealand
-
 Nigeria
-
 North Macedonia
-
 Norway
-
 Oman
-
 Pakistan
-
 Palestine
-
 Panama
-
 Papua New Guinea
-
 Paraguay
-
 Peru
-
 Philippines
-
 Poland
-
 Portugal
-
 Puerto Rico
-
 Qatar
-
 Reunion
-
 Romania
-
 Rwanda
-
 Saudi Arabia
-
 Serbia
-
 Singapore
-
 Slovakia
-
 Slovenia
-
 Somalia
-
 South Africa
-
 Spain
-
 Sri Lanka
-
 Sweden
-
 Switzerland
-
 Syria
-
 Taiwan
-
 Tajikistan
-
 Tanzania
-
 Thailand
-
 Trinidad and Tobago
-
 Tunisia
-
 Turkey
-
 UAE
-
 Uganda
-
 Ukraine
-
 United Kingdom
-
United States
-
 Uruguay
-
 Uzbekistan
-
 Venezuela
-
 Vietnam
-
 Yemen
-
 Zambia
-
 Zimbabwe
- Forex
- Crypto












