

Will AST SpaceMobile stock break $65.48 resistance as short-term rally continues?

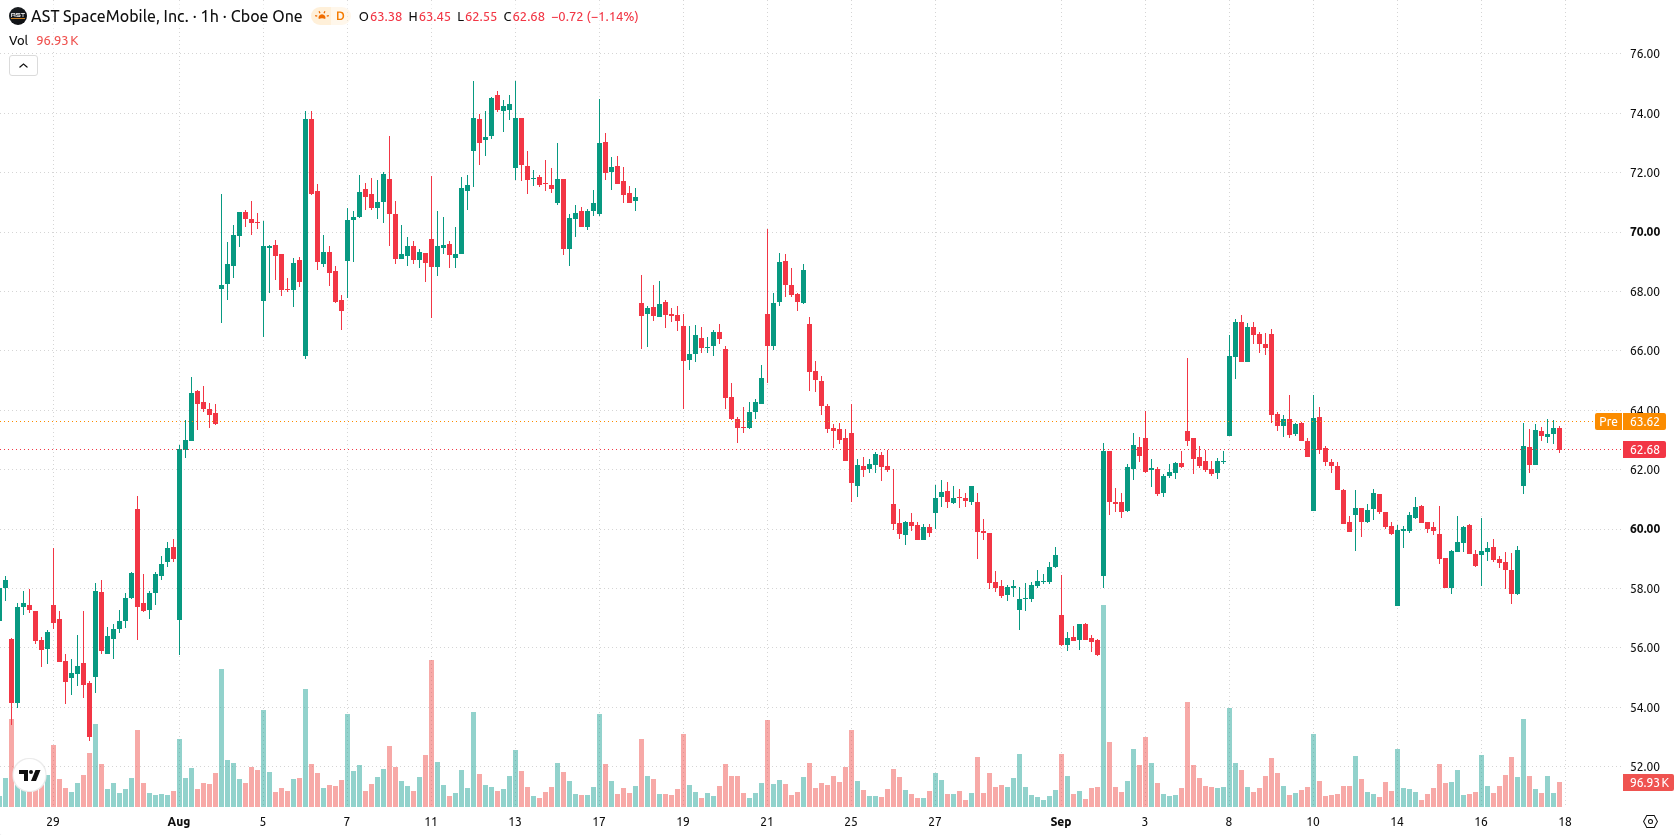
AST SpaceMobile (ASTS) stock is trading at $62.71, up 5.86% on the day. The price remains positioned above its key short- and medium-term moving averages but below its longer-term level.
 45.98
60.05
45.98
60.05
Highlights
- Pomerantz LLP has initiated a class action lawsuit alleging AST SpaceMobile misrepresented its competitive and financial status, raising uncertainty about disclosures.
- The COO and CTO have proposed large share sales under a pre-arranged plan, increasing scrutiny of executive outlook and near-term visibility.
- Shares of AST SpaceMobile trade with strong short-term bullish momentum and high volatility, with a projected price range of $59.94 to $65.48 and a 67% probability of continued upside.
Legal action elevates risk as executive sales and uncertainty weigh
Pomerantz LLP has filed a class action lawsuit against AST SpaceMobile, Inc. and certain officers, alleging securities law violations related to past representations of the company’s competitive position and financial state, according to PR Newswire. The legal action introduces heightened uncertainty regarding AST SpaceMobile’s disclosures, which can increase perceived risk and drive shifts in investor behavior. Finance Yahoo also noted that both the COO and CTO have proposed selling substantial amounts of shares under a pre-arranged trading plan, raising further questions about executive outlook and near-term visibility, while pending satellite launch updates continue to shape investor attention.
Bullish momentum persists as overbought signals warn of exhaustion
On the technical side, ASTS is trading above its MA-20 and MA-50 on the hourly chart, while remaining below the MA-200, which highlights sustained longer-term selling pressure. The Ichimoku Kijun level at $60.59 is acting as immediate support. Momentum indicators such as MACD and ADX continue to issue buy signals, with RSI in buy territory, CCI positive, and Bull/Bear Power indicating intraday buyer dominance. However, both Stoch RSI and Bull/Bear Power are now overbought, flagging a stretched near-term move, and the Awesome Oscillator stands neutral. The current setup showcases strong bullish momentum tempered by a divergence, suggesting near-term exhaustion could develop.
Consolidation likely as volatility and breakout levels define scenario
Looking ahead over the next 2–3 trading days, price is expected to consolidate within the $59.94 to $65.48 range, reflecting typical volatility levels. There is a 67% probability of further upside continuation, while the risk of a pullback stands at 33%. The baseline scenario sees the stock holding within the established corridor; a bullish breakout above $65.48 could trigger further gains, while a break below immediate support at $60.59 would open a move to test lower levels.
Earlier, analysts noted that downside risk for AST SpaceMobile remained elevated amid persistent legal scrutiny, technical pressure, and concerns over capital-raising actions. The current analysis builds on this view by highlighting that, while bullish momentum dominates the very near term, traders should closely monitor the $60.59 support as a break below this level could quickly shift price action to the downside.









-
 Afghanistan
-
 Albania
-
 Algeria
-
 Angola
-
 Argentina
-
 Armenia
-
 Australia
-
 Austria
-
 Azerbaijan
-
 Bahamas
-
 Bahrain
-
 Bangladesh
-
 Belarus
-
 Belgium
-
 Bolivia
-
 Botswana
-
 Brazil
-
 Brunei
-
 Bulgaria
-
 Cambodia
-
 Cameroon
-
 Canada
-
 Chile
Chile
-
 China
China
-
 Colombia
-
 Congo
Congo
-
 Costa Rica
-
 Cote d'Ivoire
-
 Croatia
-
 Cuba
Cuba
-
 Cyprus
-
 Czechia
-
 DR Congo
-
 Denmark
-
 Dominican Republic
-
 Ecuador
-
 Egypt
Egypt
-
 El Salvador
-
 Estonia
-
 Eswatini
-
 Ethiopia
-
 Finland
-
 France
-
 Georgia
-
 Germany
-
 Ghana
Ghana
-
 Greece
-
 Haiti
Haiti
-
 Hong Kong
-
 Hungary
-
 India
India
-
 Indonesia
-
 Iran, Islamic republic
-
 Iraq
Iraq
-
 Ireland
-
 Israel
-
 Italy
Italy
-
 Jamaica
-
 Japan
Japan
-
 Jordan
-
 Kazakhstan
-
 Kenya
Kenya
-
 Korea
Korea
-
 Kuwait
-
 Kyrgyzstan
-
 Laos
Laos
-
 Latvia
-
 Lebanon
-
 Lesotho
-
 Libya
Libya
-
 Lithuania
-
 Luxembourg
-
 Madagascar
-
 Malaysia
-
 Malta
Malta
-
 Mauritius
-
 Mexico
-
 Moldova
-
 Mongolia
-
 Montenegro
-
 Morocco
-
 Mozambique
-
 Myanmar
-
 Namibia
-
 Nepal
Nepal
-
 Netherlands
-
 New Zealand
-
 Nigeria
-
 North Macedonia
-
 Norway
-
 Oman
Oman
-
 Pakistan
-
 Palestine
-
 Panama
-
 Papua New Guinea
-
 Paraguay
-
 Peru
Peru
-
 Philippines
-
 Poland
-
 Portugal
-
 Puerto Rico
-
 Qatar
Qatar
-
 Reunion
-
 Romania
-
 Rwanda
-
 Saudi Arabia
-
 Serbia
-
 Singapore
-
 Slovakia
-
 Slovenia
-
 Somalia
-
 South Africa
-
 Spain
Spain
-
 Sri Lanka
-
 Sweden
-
 Switzerland
-
 Syria
Syria
-
 Taiwan
-
 Tajikistan
-
 Tanzania
-
 Thailand
-
 Trinidad and Tobago
-
 Tunisia
-
 Turkey
-
 UAE
UAE
-
 Uganda
-
 Ukraine
-
 United Kingdom
-
United States
-
 Uruguay
-
 Uzbekistan
-
 Venezuela
-
 Vietnam
-
 Yemen
Yemen
-
 Zambia
-
 Zimbabwe
- Forex
- Crypto












