

Reckitt Benckiser stock support test at GBX4,886: Technical outlook

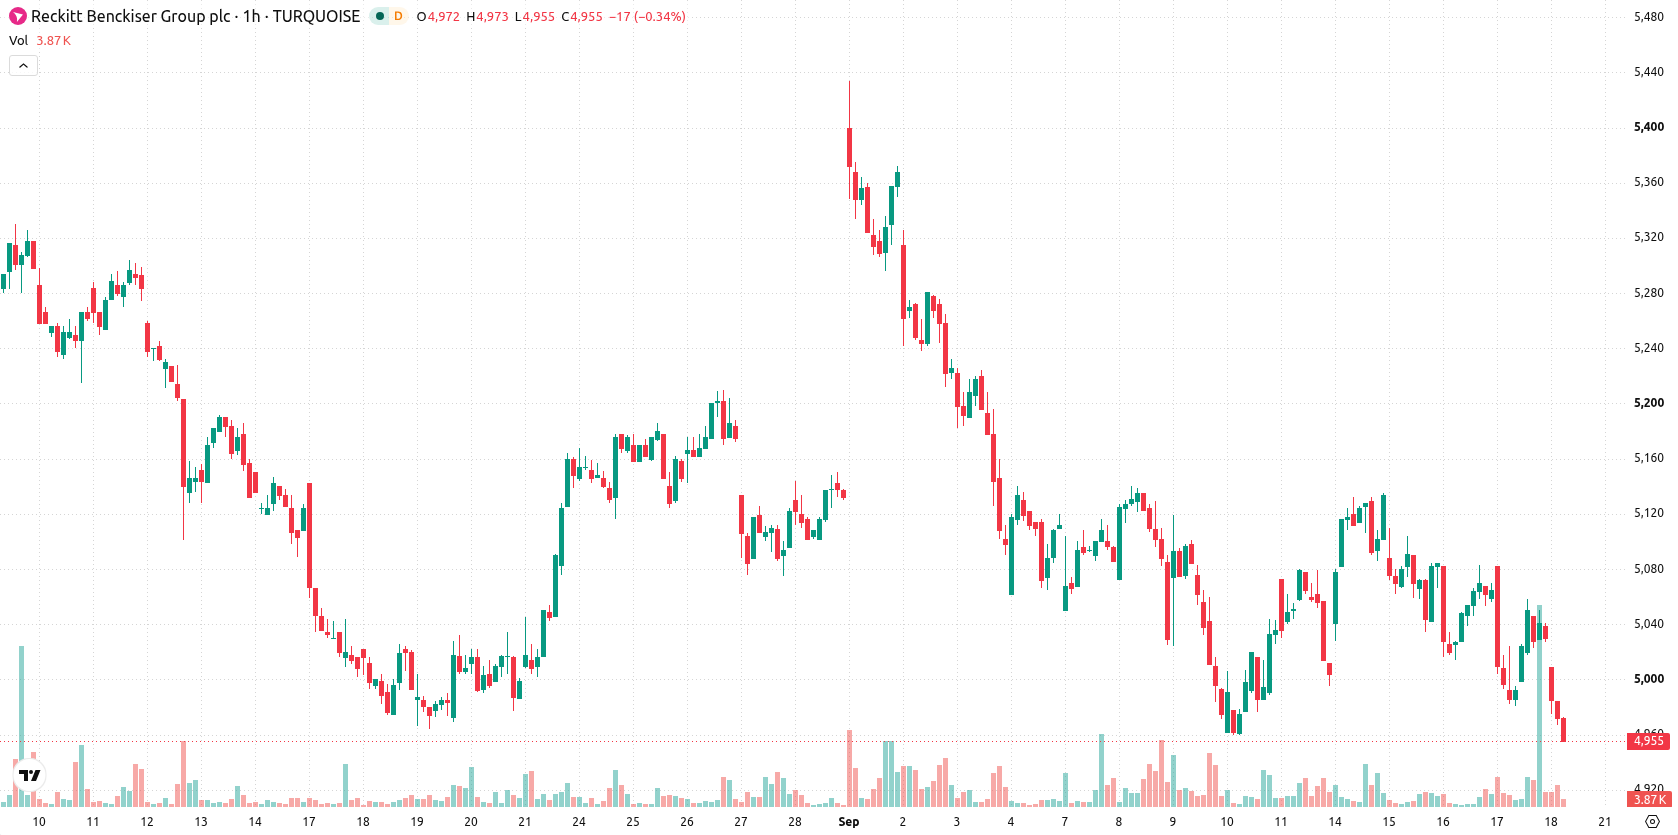
Reckitt Benckiser (RKT) stock is trading at GBX4,954 following a 1.51% decline for the day. The price remains below its key moving averages, reflecting continued pressure from the seller side.
 5716.00
5728.00
Highlights
- RKT/GBX stock trades below its key moving averages on both hourly and daily timeframes, indicating persistent downward pressure.
- Momentum and trend indicators show a strong negative bias, with several in oversold territory and sellers dominant intraday.
- The expected price range for the next 2 to 3 sessions is GBX4,886 to GBX5,021, with high probability of further downside.
Downward momentum prevails as technical signals confirm oversold risks
RKT is trading below the MA-20 (GBX5,028) and MA-50 (GBX5,054) on the hourly chart and remains below the MA-200 (GBX5,351) on the daily timeframe. The Ichimoku Kijun at GBX5,046 marks the immediate resistance. MACD signals Sell, while ADX is Neutral, pointing to weakened trend strength. RSI is at 37.14 and in Sell territory, Stoch RSI is Oversold, and both CCI and Bull/Bear Power indicate an oversold condition, underscoring strong seller control intraday. Awesome Oscillator confirms the prevailing downward momentum.
Further losses likely as volatility caps rebound prospects
Over the next 2–3 trading days, the price is expected to range between GBX4,886 and GBX5,021. The likelihood of further downside is very high, while a rebound is improbable. The central scenario involves sideways action within the projected volatility band; a break above GBX5,046 would be required for a bullish turn, while a drop below GBX4,886 could drive additional losses.
Earlier, analysts noted that Reckitt Benckiser was experiencing persistent downside risk amid broadly negative technical signals. The latest analysis reinforces this bearish outlook, highlighting GBX5,046 as a key resistance level and identifying a potential breakdown below GBX4,886 as a critical risk for near-term trading strategies.











-
 Afghanistan
-
 Albania
-
 Algeria
-
 Angola
-
 Argentina
-
 Armenia
-
 Australia
-
 Austria
-
 Azerbaijan
-
 Bahamas
-
 Bahrain
-
 Bangladesh
-
 Belarus
-
 Belgium
-
 Bolivia
-
 Botswana
-
 Brazil
-
 Brunei
-
 Bulgaria
-
 Cambodia
-
 Cameroon
-
 Canada
-
 Chile
-
 China
-
 Colombia
-
 Congo
-
 Costa Rica
-
 Cote d'Ivoire
-
 Croatia
-
 Cuba
-
 Cyprus
-
 Czechia
-
 DR Congo
-
 Denmark
-
 Dominican Republic
-
 Ecuador
-
 Egypt
-
 El Salvador
-
 Estonia
-
 Eswatini
-
 Ethiopia
-
 Finland
-
 France
-
 Georgia
-
 Germany
-
 Ghana
-
 Greece
-
 Haiti
-
 Hong Kong
-
 Hungary
-
 India
-
 Indonesia
-
 Iran, Islamic republic
-
 Iraq
-
 Ireland
-
 Israel
-
 Italy
-
 Jamaica
-
 Japan
-
 Jordan
-
 Kazakhstan
-
 Kenya
-
 Korea
-
 Kuwait
-
 Kyrgyzstan
-
 Laos
-
 Latvia
-
 Lebanon
-
 Lesotho
-
 Libya
-
 Lithuania
-
 Luxembourg
-
 Madagascar
-
 Malaysia
-
 Malta
-
 Mauritius
-
 Mexico
-
 Moldova
-
 Mongolia
-
 Montenegro
-
 Morocco
-
 Mozambique
-
 Myanmar
-
 Namibia
-
 Nepal
-
 Netherlands
-
 New Zealand
-
 Nigeria
-
 North Macedonia
-
 Norway
-
 Oman
-
 Pakistan
-
 Palestine
-
 Panama
-
 Papua New Guinea
-
 Paraguay
-
 Peru
-
 Philippines
-
 Poland
-
 Portugal
-
 Puerto Rico
-
 Qatar
-
 Reunion
-
 Romania
-
 Rwanda
-
 Saudi Arabia
-
 Serbia
-
 Singapore
-
 Slovakia
-
 Slovenia
-
 Somalia
-
 South Africa
-
 Spain
-
 Sri Lanka
-
 Sweden
-
 Switzerland
-
 Syria
-
 Taiwan
-
 Tajikistan
-
 Tanzania
-
 Thailand
-
 Trinidad and Tobago
-
 Tunisia
-
 Turkey
-
 UAE
-
 Uganda
-
 Ukraine
-
 United Kingdom
-
United States
-
 Uruguay
-
 Uzbekistan
-
 Venezuela
-
 Vietnam
-
 Yemen
-
 Zambia
-
 Zimbabwe
- Forex
- Crypto












