

Why is Netflix stock down today? Weak momentum and support levels to watch

Netflix (NFLX) stock is trading at $72.00, down 4.4% for the day and closing near its session low. The stock remains below its key moving averages, reflecting continued downward momentum.
 64.35
66.78
Highlights
- Pershing Square re-established a $1 billion position in Netflix stock after previously exiting in 2022.
- Representative Byron Donalds disclosed buying a small stake in Netflix during August, showing selective institutional participation.
- Netflix stock trades below key moving averages with bearish momentum signals, and the next projected range is $69.45 to $75.31.
Institutional buying returns amid heightened uncertainty and muted price action
Bill Ackman's Pershing Square re-established a position in Netflix with an investment of approximately $1 billion after having fully exited the stock in 2022, according to Investing.com. This sizable purchase introduces additional institutional demand and signals renewed interest from a prominent fund manager at a time of wider market uncertainty. Also in recent activity, Representative Byron Donalds disclosed the acquisition of a small stake in Netflix during August. Both events reflect selective institutional participation, though price action has remained under broader selling pressure.
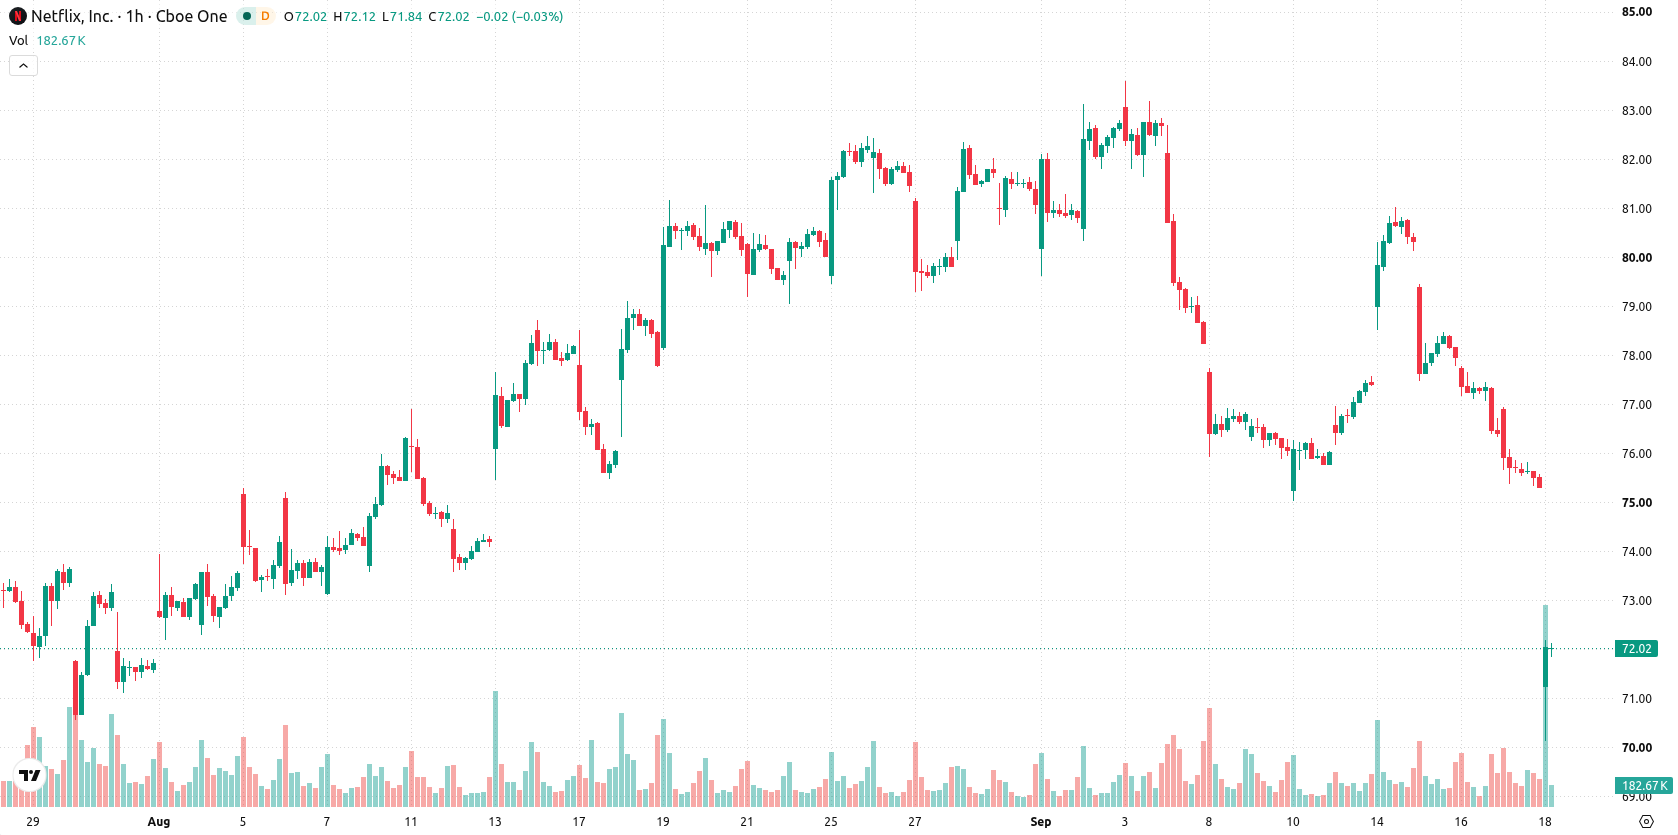
Oversold readings deepen as NFLX breaches key technical levels
NFLX is trading below its MA-20 ($76.75) and MA-50 ($77.18) on the hourly chart, and also below the long-term MA-200 ($85.67) on the daily chart. The closest resistance on the chart is the Ichimoku Kijun at $78.16. Indicators present a strongly bearish profile: MACD, ADX, and Awesome Oscillator all point to selling pressure, with the RSI at 28.66 highlighting deeply oversold conditions. Both the Stoch RSI and the CCI generate oversold and sell signals, respectively. Bull/Bear Power underscores active intraday selling dominance, and the session closed without notable divergences among oscillators or trend indicators.
Downside scenario holds as narrow range limits rebound potential
Over the next several sessions, NFLX is likely to trade in a range between $69.45 and $75.31, consistent with typical volatility. The probabilities favor a continued decline, while odds of a significant rebound remain low. The base case scenario is for price to remain within this corridor. A move above resistance at $78.16 would be required to challenge existing weakness, while a breakdown below support at $69.45 could open the way for further losses.
Earlier, analysts noted that Netflix shares were pressured by analyst downgrades and weaker content outlooks, contributing to broader sector declines. While recent high-profile institutional buying introduces new dynamics, traders should monitor the $69.45 support as a potential inflection point for further downside risk.






Latest Netflix News




-
 Afghanistan
-
 Albania
-
 Algeria
-
 Angola
-
 Argentina
-
 Armenia
-
 Australia
-
 Austria
-
 Azerbaijan
-
 Bahamas
-
 Bahrain
-
 Bangladesh
-
 Belarus
-
 Belgium
-
 Bolivia
-
 Botswana
-
 Brazil
-
 Brunei
-
 Bulgaria
-
 Cambodia
-
 Cameroon
-
 Canada
-
 Chile
-
 China
-
 Colombia
-
 Congo
-
 Costa Rica
-
 Cote d'Ivoire
-
 Croatia
-
 Cuba
-
 Cyprus
-
 Czechia
-
 DR Congo
-
 Denmark
-
 Dominican Republic
-
 Ecuador
-
 Egypt
-
 El Salvador
-
 Estonia
-
 Eswatini
-
 Ethiopia
-
 Finland
-
 France
-
 Georgia
-
 Germany
-
 Ghana
-
 Greece
-
 Haiti
-
 Hong Kong
-
 Hungary
-
 India
-
 Indonesia
-
 Iran, Islamic republic
-
 Iraq
-
 Ireland
-
 Israel
-
 Italy
-
 Jamaica
-
 Japan
-
 Jordan
-
 Kazakhstan
-
 Kenya
-
 Korea
-
 Kuwait
-
 Kyrgyzstan
-
 Laos
-
 Latvia
-
 Lebanon
-
 Lesotho
-
 Libya
-
 Lithuania
-
 Luxembourg
-
 Madagascar
-
 Malaysia
-
 Malta
-
 Mauritius
-
 Mexico
-
 Moldova
-
 Mongolia
-
 Montenegro
-
 Morocco
-
 Mozambique
-
 Myanmar
-
 Namibia
-
 Nepal
-
 Netherlands
-
 New Zealand
-
 Nigeria
-
 North Macedonia
-
 Norway
-
 Oman
-
 Pakistan
-
 Palestine
-
 Panama
-
 Papua New Guinea
-
 Paraguay
-
 Peru
-
 Philippines
-
 Poland
-
 Portugal
-
 Puerto Rico
-
 Qatar
-
 Reunion
-
 Romania
-
 Rwanda
-
 Saudi Arabia
-
 Serbia
-
 Singapore
-
 Slovakia
-
 Slovenia
-
 Somalia
-
 South Africa
-
 Spain
-
 Sri Lanka
-
 Sweden
-
 Switzerland
-
 Syria
-
 Taiwan
-
 Tajikistan
-
 Tanzania
-
 Thailand
-
 Trinidad and Tobago
-
 Tunisia
-
 Turkey
-
 UAE
-
 Uganda
-
 Ukraine
-
 United Kingdom
-
United States
-
 Uruguay
-
 Uzbekistan
-
 Venezuela
-
 Vietnam
-
 Yemen
-
 Zambia
-
 Zimbabwe
- Forex
- Crypto












