

Operating margin decline from AI investments: Can Zoom stock hold support?

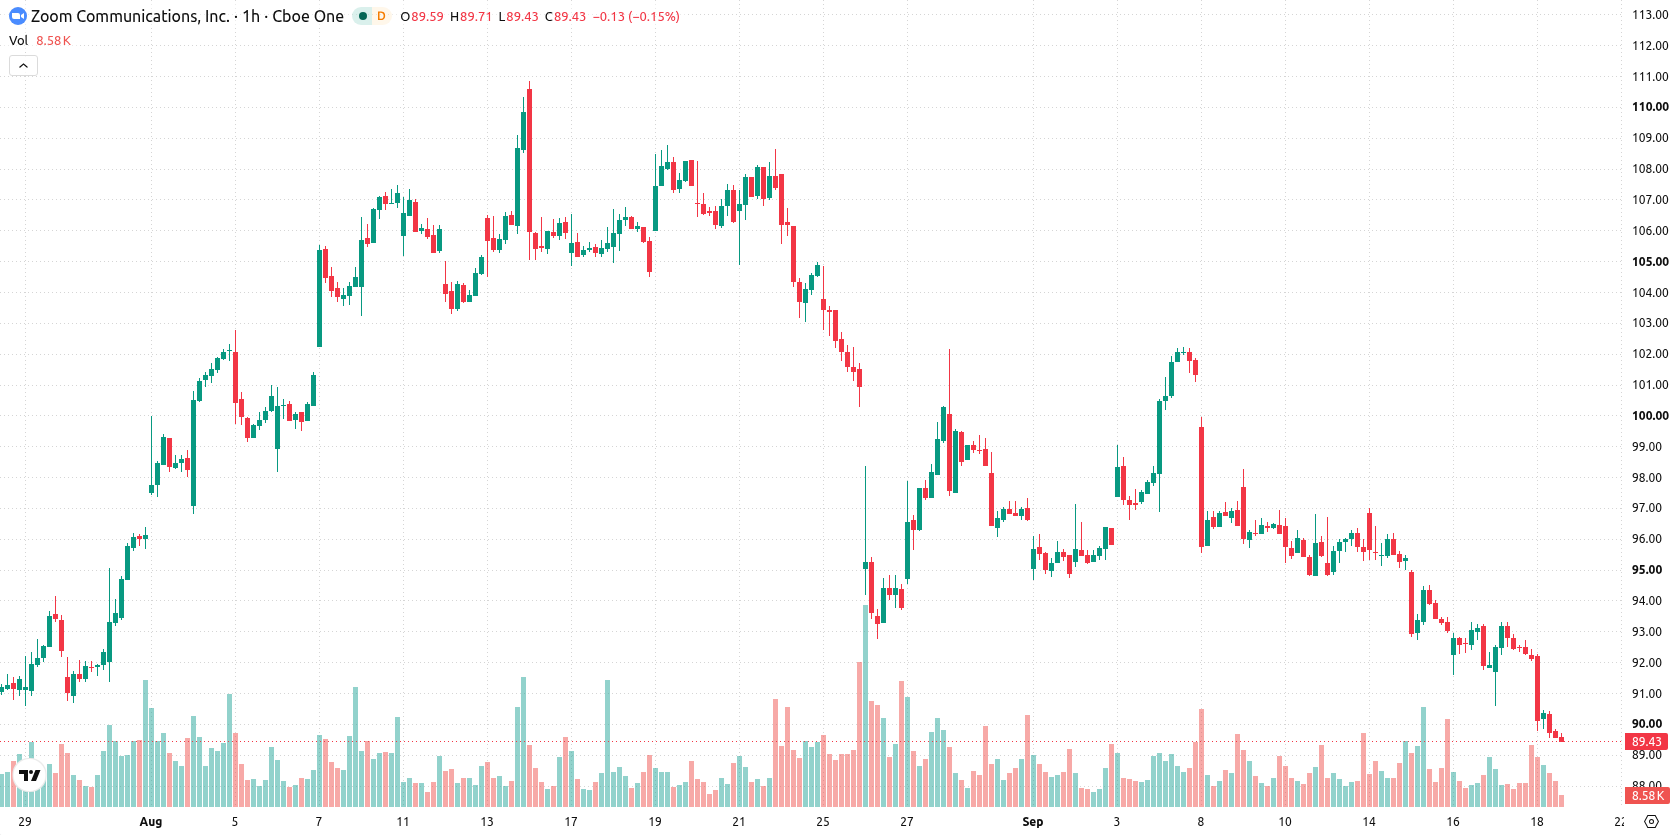
Zoom (ZM) stock is trading at $89.28 today, down 3.11% on the session and holding near the lower end of its recent trading range. The price remains anchored below its key moving averages, reflecting persistent downside momentum.
 99.11
99.98
99.11
99.98
Highlights
- Zoom reported Q2 FY27 revenue of $1.28 billion, up 4.9% year over year, with enterprise revenue growing 7.8%.
- Full-year revenue and EPS guidance increased, and the Common Room acquisition expands buyer intelligence within Revenue OS.
- Shares of Zoom trade below key moving averages and face sustained selling pressure, with likely range of $86.83 to $91.73 in the coming days.
Rising enterprise revenue and upbeat outlook as pressure on shares persists
Zoom posted Q2 FY27 revenue of $1.28 billion, a 4.9% increase from the prior year, highlighting resilient customer demand and an expanding business footprint. The company noted a 7.8% growth in enterprise revenue, its strongest performance in three years, though its non-GAAP operating margin slipped by 130 basis points to 40% due to strategic investments in AI infrastructure. According to Scanx, Zoom increased its full-year revenue guidance and EPS outlook, reflecting confidence in business trends, while the mid-July acquisition of Common Room, as reported by Benzinga, adds buyer intelligence capabilities to its Revenue OS offering. These positive developments occurred even as price action has remained under broader selling pressure.
Downside bias holds as price rejected at key technical levels
On the technical front, ZM is trading below the MA-20 ($92.86) and MA-50 ($94.56) on the hourly chart, as well as beneath the MA-200 at $90.95 on the daily timeframe. The Ichimoku Kijun sits at $93.47, presenting immediate resistance above current levels. Key support is identified at $86.83, while overhead resistance is seen at $91.73 and again at $93.47. Indicator readings show MACD at Strong Sell, ADX remaining Neutral, RSI at a low 37.22 (Sell), and both CCI and Bull/Bear Power also giving Sell signals. Stoch RSI and Awesome Oscillator remain Neutral, suggesting momentum is consistently negative but not accelerating further.
Sideways-to-lower outlook as limited upside and support risks converge
In the short term, ZM is likely to oscillate within the $86.83–$91.73 range, reflecting typical volatility bands at current levels. The probability of a strong upward move is considered very low, while further downside risk remains elevated if support at $86.83 fails. The base case scenario is for continued sideways to lower trading until a decisive breakout or breakdown occurs, with a potential bullish shift only if price can reclaim resistance above $93.47.
Earlier, analysts noted that Zoom's technical outlook was mixed, with price action suggesting a tendency toward consolidation and increased downside risk if support levels were breached. The current data reinforces that cautious view, as persistent negative momentum leaves $86.83 as the pivotal support to watch for signs of either further declines or potential stabilization.










-
 Afghanistan
-
 Albania
-
 Algeria
-
 Angola
-
 Argentina
-
 Armenia
-
 Australia
-
 Austria
-
 Azerbaijan
-
 Bahamas
-
 Bahrain
-
 Bangladesh
-
 Belarus
-
 Belgium
-
 Bolivia
-
 Botswana
-
 Brazil
-
 Brunei
-
 Bulgaria
-
 Cambodia
-
 Cameroon
-
 Canada
-
 Chile
Chile
-
 China
China
-
 Colombia
-
 Congo
Congo
-
 Costa Rica
-
 Cote d'Ivoire
-
 Croatia
-
 Cuba
Cuba
-
 Cyprus
-
 Czechia
-
 DR Congo
-
 Denmark
-
 Dominican Republic
-
 Ecuador
-
 Egypt
Egypt
-
 El Salvador
-
 Estonia
-
 Eswatini
-
 Ethiopia
-
 Finland
-
 France
-
 Georgia
-
 Germany
-
 Ghana
Ghana
-
 Greece
-
 Haiti
Haiti
-
 Hong Kong
-
 Hungary
-
 India
India
-
 Indonesia
-
 Iran, Islamic republic
-
 Iraq
Iraq
-
 Ireland
-
 Israel
-
 Italy
Italy
-
 Jamaica
-
 Japan
Japan
-
 Jordan
-
 Kazakhstan
-
 Kenya
Kenya
-
 Korea
Korea
-
 Kuwait
-
 Kyrgyzstan
-
 Laos
Laos
-
 Latvia
-
 Lebanon
-
 Lesotho
-
 Libya
Libya
-
 Lithuania
-
 Luxembourg
-
 Madagascar
-
 Malaysia
-
 Malta
Malta
-
 Mauritius
-
 Mexico
-
 Moldova
-
 Mongolia
-
 Montenegro
-
 Morocco
-
 Mozambique
-
 Myanmar
-
 Namibia
-
 Nepal
Nepal
-
 Netherlands
-
 New Zealand
-
 Nigeria
-
 North Macedonia
-
 Norway
-
 Oman
Oman
-
 Pakistan
-
 Palestine
-
 Panama
-
 Papua New Guinea
-
 Paraguay
-
 Peru
Peru
-
 Philippines
-
 Poland
-
 Portugal
-
 Puerto Rico
-
 Qatar
Qatar
-
 Reunion
-
 Romania
-
 Rwanda
-
 Saudi Arabia
-
 Serbia
-
 Singapore
-
 Slovakia
-
 Slovenia
-
 Somalia
-
 South Africa
-
 Spain
Spain
-
 Sri Lanka
-
 Sweden
-
 Switzerland
-
 Syria
Syria
-
 Taiwan
-
 Tajikistan
-
 Tanzania
-
 Thailand
-
 Trinidad and Tobago
-
 Tunisia
-
 Turkey
-
 UAE
UAE
-
 Uganda
-
 Ukraine
-
 United Kingdom
-
United States
-
 Uruguay
-
 Uzbekistan
-
 Venezuela
-
 Vietnam
-
 Yemen
Yemen
-
 Zambia
-
 Zimbabwe
- Forex
- Crypto












