

Will Reckitt Benckiser stock test resistance as trading nears session highs?

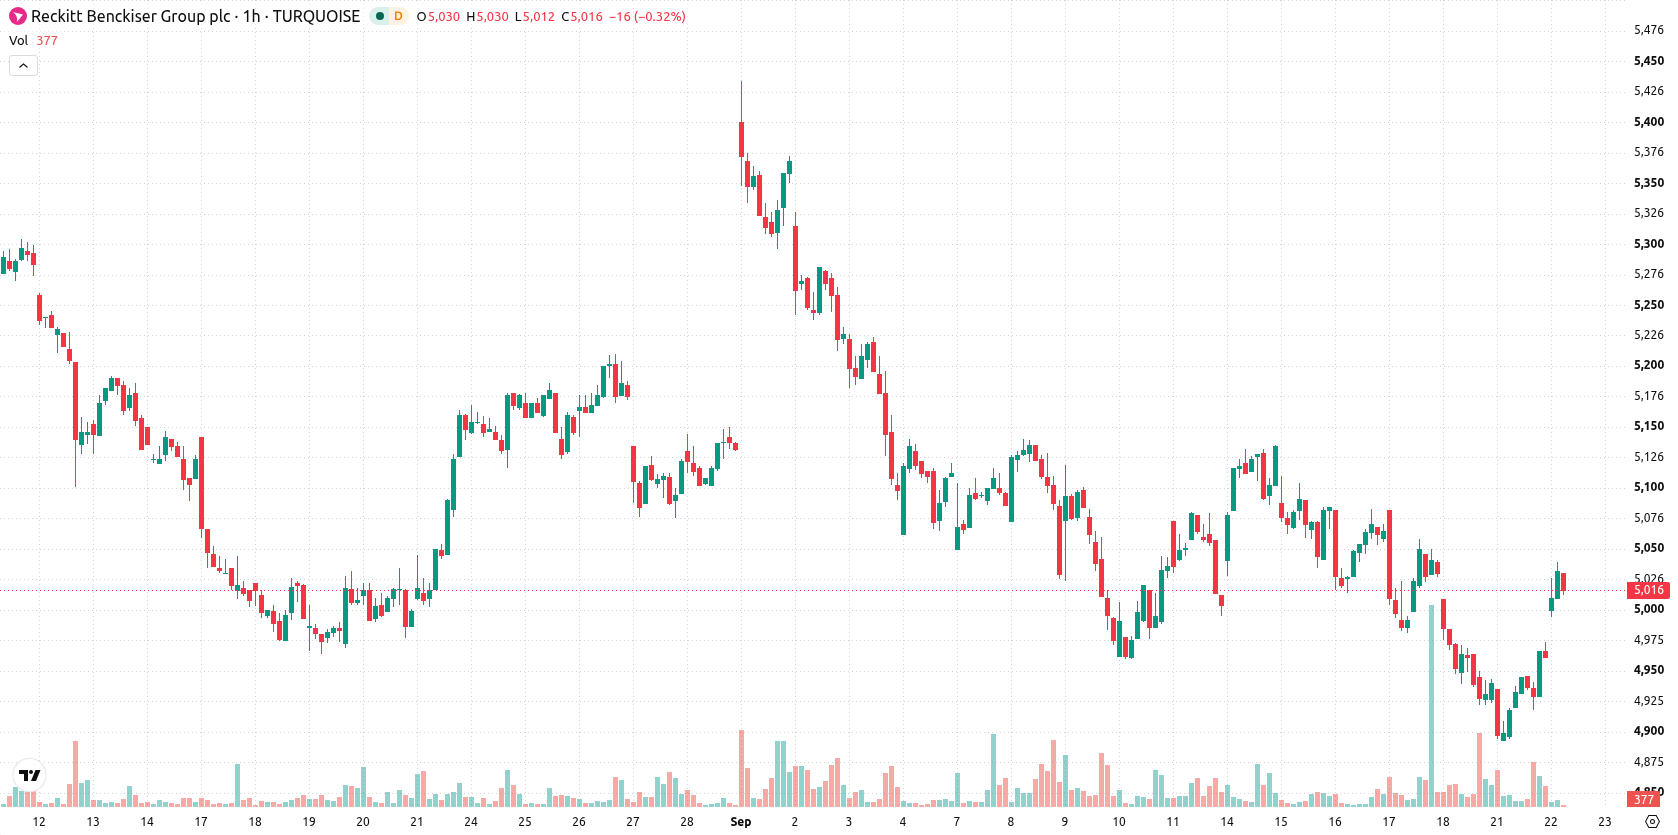
Reckitt Benckiser (RKT) stock is trading at GBX5,024 after a modest up session. The price remains above its key short- and medium-term moving averages, reflecting near-term upward momentum.
 5716.00
5728.00
Highlights
- RKT/GBX trades above short- and medium-term moving averages but remains below the long-term average, indicating mixed trend direction.
- Oscillator signals are divided, with overbought readings and neutral-to-bearish momentum suggesting buyer dominance but weak trend strength.
- Next sessions are expected to see RKT/GBX fluctuate between GBX4,938 and GBX5,109, with downside reversal slightly more probable than further gains.
Mixed technical signals as intraday upside meets overbought risks
On the H1 timeframe, RKT is trading above its MA-20 at GBX4,948 and MA-50 at GBX5,011, while still below its MA-200 at GBX5,341 on the daily chart. Immediate support is situated at the Ichimoku Kijun level of GBX4,985, marking the nearest key reference point intraday. The MACD posts a strong sell signal, indicating lingering downside risk; meanwhile, the ADX is neutral, suggesting indecisive trend strength. RSI points to a buy, but Stoch RSI, CCI, and Bull/Bear Power all highlight recent overbought conditions and ongoing buyer dominance. The Awesome Oscillator is neutral, and intraday activity is characterized by low volatility, a minor upside gap, and trading near the session’s high.
Short-term reversal odds rise as volatility band narrows
Looking ahead, the projected trading band for the next few sessions is GBX4,938 to GBX5,109. The base scenario anticipates price oscillating within this volatility band. While the technical forecast gives a marginally higher probability to a short-term reversal (52%) than to continued strength (48%), both directions remain plausible. An upward scenario would see RKT challenge resistance and potentially move toward GBX5,109, while a downside scenario could unfold if price drops below immediate support, exposing the lower end of the band and raising further downside risk.
In a recent review, analysts highlighted ongoing bearish momentum and seller dominance in Reckitt Benckiser shares. The current analysis presents a more balanced outlook, with traders advised to monitor the potential for a short-term reversal as price action approaches the upper bound of the projected trading range.











-
 Afghanistan
-
 Albania
-
 Algeria
-
 Angola
-
 Argentina
-
 Armenia
-
 Australia
-
 Austria
-
 Azerbaijan
-
 Bahamas
-
 Bahrain
-
 Bangladesh
-
 Belarus
-
 Belgium
-
 Bolivia
-
 Botswana
-
 Brazil
-
 Brunei
-
 Bulgaria
-
 Cambodia
-
 Cameroon
-
 Canada
-
 Chile
-
 China
-
 Colombia
-
 Congo
-
 Costa Rica
-
 Cote d'Ivoire
-
 Croatia
-
 Cuba
-
 Cyprus
-
 Czechia
-
 DR Congo
-
 Denmark
-
 Dominican Republic
-
 Ecuador
-
 Egypt
-
 El Salvador
-
 Estonia
-
 Eswatini
-
 Ethiopia
-
 Finland
-
 France
-
 Georgia
-
 Germany
-
 Ghana
-
 Greece
-
 Haiti
-
 Hong Kong
-
 Hungary
-
 India
-
 Indonesia
-
 Iran, Islamic republic
-
 Iraq
-
 Ireland
-
 Israel
-
 Italy
-
 Jamaica
-
 Japan
-
 Jordan
-
 Kazakhstan
-
 Kenya
-
 Korea
-
 Kuwait
-
 Kyrgyzstan
-
 Laos
-
 Latvia
-
 Lebanon
-
 Lesotho
-
 Libya
-
 Lithuania
-
 Luxembourg
-
 Madagascar
-
 Malaysia
-
 Malta
-
 Mauritius
-
 Mexico
-
 Moldova
-
 Mongolia
-
 Montenegro
-
 Morocco
-
 Mozambique
-
 Myanmar
-
 Namibia
-
 Nepal
-
 Netherlands
-
 New Zealand
-
 Nigeria
-
 North Macedonia
-
 Norway
-
 Oman
-
 Pakistan
-
 Palestine
-
 Panama
-
 Papua New Guinea
-
 Paraguay
-
 Peru
-
 Philippines
-
 Poland
-
 Portugal
-
 Puerto Rico
-
 Qatar
-
 Reunion
-
 Romania
-
 Rwanda
-
 Saudi Arabia
-
 Serbia
-
 Singapore
-
 Slovakia
-
 Slovenia
-
 Somalia
-
 South Africa
-
 Spain
-
 Sri Lanka
-
 Sweden
-
 Switzerland
-
 Syria
-
 Taiwan
-
 Tajikistan
-
 Tanzania
-
 Thailand
-
 Trinidad and Tobago
-
 Tunisia
-
 Turkey
-
 UAE
-
 Uganda
-
 Ukraine
-
 United Kingdom
-
United States
-
 Uruguay
-
 Uzbekistan
-
 Venezuela
-
 Vietnam
-
 Yemen
-
 Zambia
-
 Zimbabwe
- Forex
- Crypto












