

Why is Enbridge stock flat today? Key resistance levels to watch

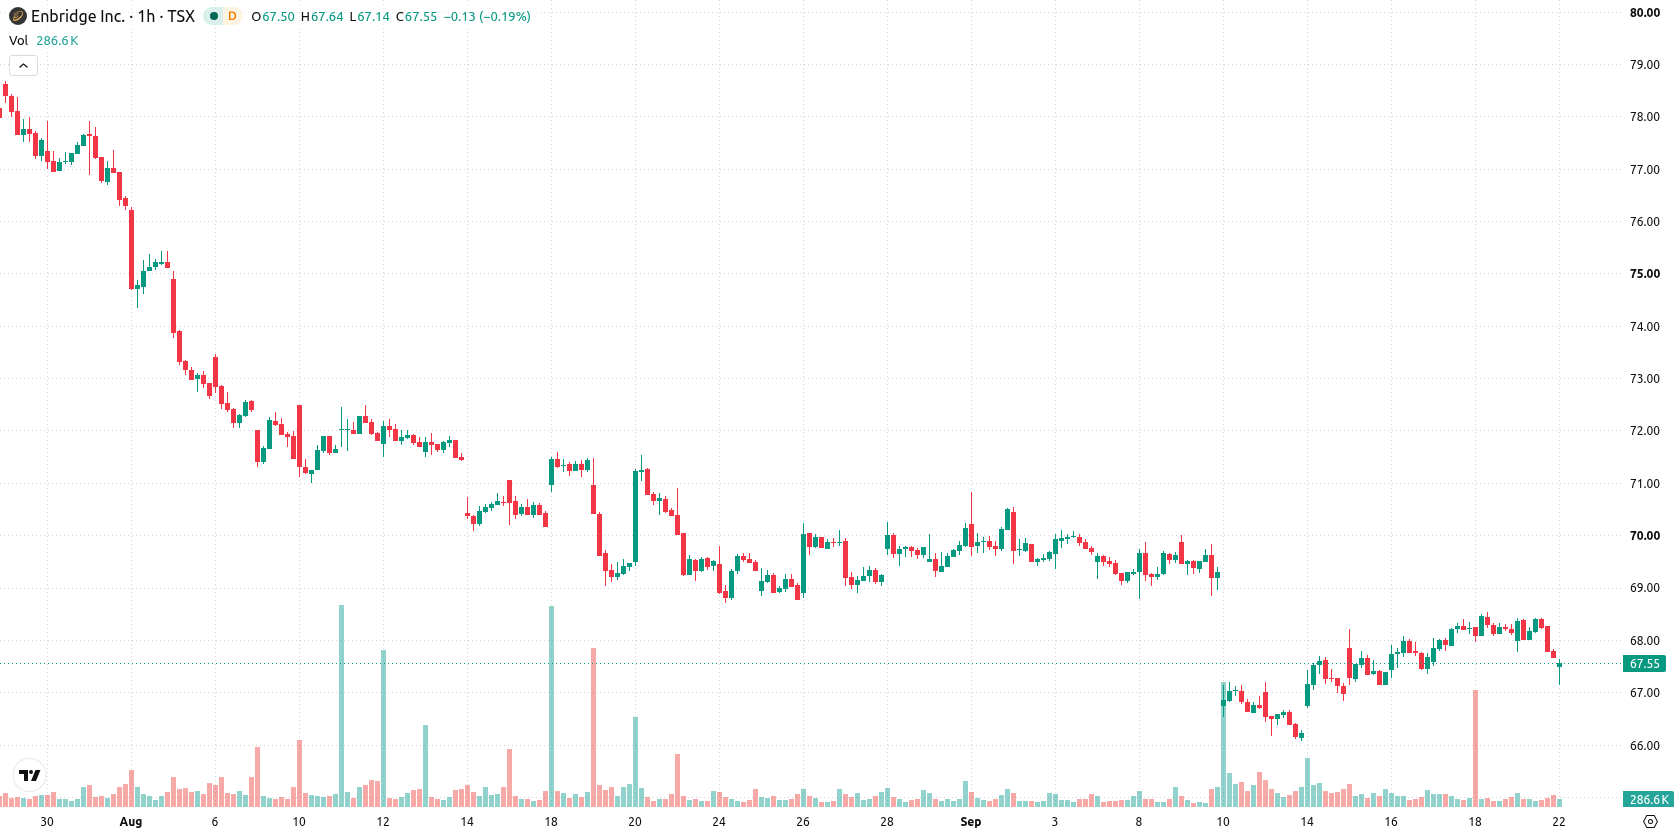
Enbridge (ENB) stock is trading at C$67.94 after a modest intraday gain, moving near the top of today's narrow range. The price currently sits below its key short-term average but above its medium-term average, reflecting a balance between weak and stabilizing momentum.
 68.27
68.97
Highlights
- Enbridge stock offers a 5.7% yield with 31 consecutive years of dividend increases anchoring its appeal to income investors.
- Stable distributable cash flow supports continuing capital returns, securing Enbridge stock’s profile as a reliable yield vehicle.
- ENB stock trades in a C$67.32 to C$68.49 range with technical indicators favoring further downside and seller dominance intraday.
Investor yield demand persists as dividend policy drives flows
Enbridge Inc. has prioritized steady returns to shareholders, increasing its dividend annually for 31 consecutive years, resulting in a current yield of 5.7%, according to Fool. This ongoing commitment of capital to shareholders highlights stable distributable cash flow and provides an income anchor to the stock amid market fluctuations. As a result, ENB shares continue to attract investors seeking reliable yield, with the company's record of distribution serving as a key term driver.
Oscillator divergences flag rebound risk amid heavy oversold signals
On the H1 chart, ENB is positioned below the MA-20 and above the MA-50, while on the daily timeframe it remains capped by the MA-200. The Ichimoku Kijun at C$67.87 acts as immediate support. Momentum indicators show MACD and ADX in a neutral stance; RSI prints 36.47, placing it in oversold territory. Stochastic RSI, CCI, and Bull/Bear Power all reflect a strong presence of sellers and oversold conditions intraday, with oscillator divergences highlighting uncertainty between persistent short-term weakness and potential for a technical rebound.
Consolidation likely within range as breakout levels define direction
Looking ahead, the typical volatility band is expected between C$67.32 (support) and C$68.49 (resistance) over the coming sessions. There is a moderate likelihood of price consolidating within this range. A bullish scenario would require a break above C$68.49, indicating further recovery potential, while a drop below C$67.32 would signal renewed downside momentum.
Earlier, analysts noted that Enbridge’s combination of strategic acquisitions and technical setup suggested a near-term phase of consolidation with cautious upside potential. The current assessment adds a longer-term dimension by underscoring Enbridge’s robust dividend track record, signaling that any resolution from the present support-resistance band could attract yield-focused investors as a stabilizing force amid short-term volatility.










-
 Afghanistan
-
 Albania
-
 Algeria
-
 Angola
-
 Argentina
-
 Armenia
-
 Australia
-
 Austria
-
 Azerbaijan
-
 Bahamas
-
 Bahrain
-
 Bangladesh
-
 Belarus
-
 Belgium
-
 Bolivia
-
 Botswana
-
 Brazil
-
 Brunei
-
 Bulgaria
-
 Cambodia
-
 Cameroon
-
 Canada
-
 Chile
-
 China
-
 Colombia
-
 Congo
-
 Costa Rica
-
 Cote d'Ivoire
-
 Croatia
-
 Cuba
-
 Cyprus
-
 Czechia
-
 DR Congo
-
 Denmark
-
 Dominican Republic
-
 Ecuador
-
 Egypt
-
 El Salvador
-
 Estonia
-
 Eswatini
-
 Ethiopia
-
 Finland
-
 France
-
 Georgia
-
 Germany
-
 Ghana
-
 Greece
-
 Haiti
-
 Hong Kong
-
 Hungary
-
 India
-
 Indonesia
-
 Iran, Islamic republic
-
 Iraq
-
 Ireland
-
 Israel
-
 Italy
-
 Jamaica
-
 Japan
-
 Jordan
-
 Kazakhstan
-
 Kenya
-
 Korea
-
 Kuwait
-
 Kyrgyzstan
-
 Laos
-
 Latvia
-
 Lebanon
-
 Lesotho
-
 Libya
-
 Lithuania
-
 Luxembourg
-
 Madagascar
-
 Malaysia
-
 Malta
-
 Mauritius
-
 Mexico
-
 Moldova
-
 Mongolia
-
 Montenegro
-
 Morocco
-
 Mozambique
-
 Myanmar
-
 Namibia
-
 Nepal
-
 Netherlands
-
 New Zealand
-
 Nigeria
-
 North Macedonia
-
 Norway
-
 Oman
-
 Pakistan
-
 Palestine
-
 Panama
-
 Papua New Guinea
-
 Paraguay
-
 Peru
-
 Philippines
-
 Poland
-
 Portugal
-
 Puerto Rico
-
 Qatar
-
 Reunion
-
 Romania
-
 Rwanda
-
 Saudi Arabia
-
 Serbia
-
 Singapore
-
 Slovakia
-
 Slovenia
-
 Somalia
-
 South Africa
-
 Spain
-
 Sri Lanka
-
 Sweden
-
 Switzerland
-
 Syria
-
 Taiwan
-
 Tajikistan
-
 Tanzania
-
 Thailand
-
 Trinidad and Tobago
-
 Tunisia
-
 Turkey
-
 UAE
-
 Uganda
-
 Ukraine
-
 United Kingdom
-
United States
-
 Uruguay
-
 Uzbekistan
-
 Venezuela
-
 Vietnam
-
 Yemen
-
 Zambia
-
 Zimbabwe
- Forex
- Crypto












