

What's behind Aviva's latest 2.0% stock pullback?

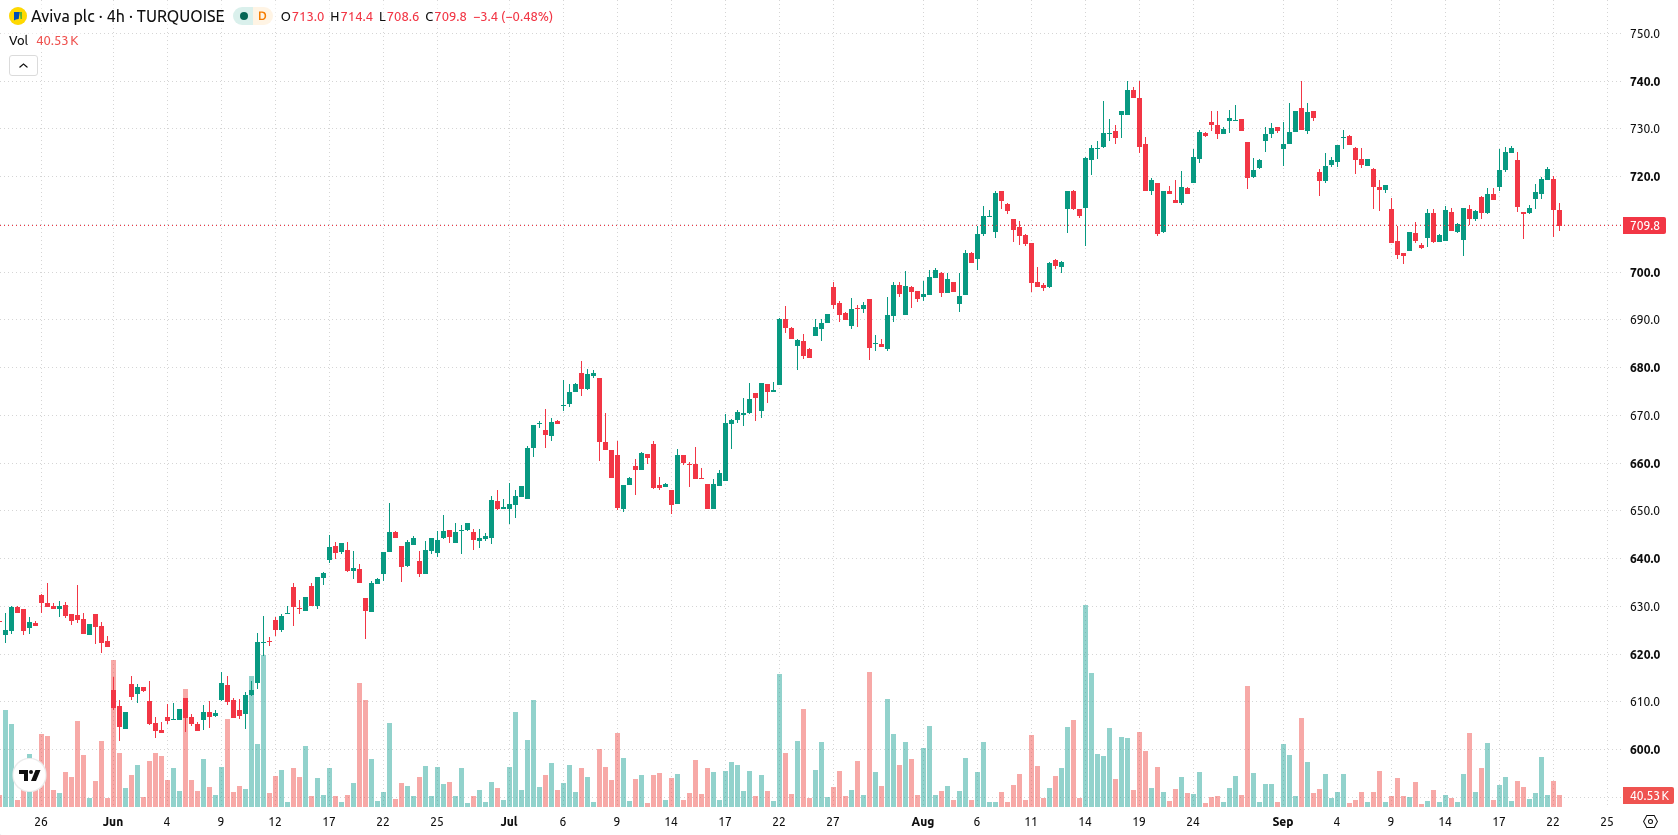
Aviva plc (AV) slid 2.00% after opening lower, with downside pressure dominating the session even as recent half-year financial results showed rising operating profit from growth in core segments and disciplined underwriting. The decline is supported by the stock falling below its 20-day moving average and stalling just above near-term support, as technical signals point to weakness despite a bullish long-term trend.
 713.00
711.40
713.00
711.40
Highlights
- Aviva recorded increased operating profit in the first half of 2026, supported by disciplined underwriting and expansion in core businesses.
- The company’s solvency ratio remains well above regulatory minimums, providing flexibility for dividends and share buybacks, and substantial total returns since 2023.
- Shares of Aviva are under short-term selling pressure near GBX707.2, with a high probability of trading between GBX697.4 and GBX717 despite mixed momentum signals.
Dividend flexibility rises as investor sentiment faces selling pressure
Aviva reported an increase in operating profit for the first half of 2026, attributed to disciplined underwriting and growth in core business segments. The company’s solvency ratio was reported well above regulatory minimums, providing management with flexibility for dividends and selective share buybacks. Substantial three-year total returns, including dividends, were also recorded for investors since 2023. New research published by Aviva indicated that significant life events are prompting UK households to focus more on financial protection, though price action has remained under broader selling pressure.
Mixed momentum as short-term weakness persists above key supports
Aviva is currently trading below its 20-day moving average (GBX720.69) but remains above both the 50-day (GBX705.36) and 200-day (GBX657.36) levels, indicating short-term pressure from sellers but a medium- and long-term bullish structure. The nearest support is at GBX706.8, with resistance at GBX707.4, while the 50-day versus 200-day alignment confirms a positive long-term trend. Momentum readings are mixed: the MACD signals strong bullish momentum, but the ADX remains neutral. RSI and Stochastic RSI suggest buying interest without clear overbought or oversold extremes, while CCI and AO are neutral. Bull/Bear Power at 4.67 confirms buyers dominate intraday, yet the broader forecast notes an overbought condition. The session opened with a 0.47% downside gap, with price near the session low and intraday volatility at 1.53%. Momentum signals currently diverge from sluggish price action.
Earlier, analysts noted that Aviva faced heightened short-term downside risks as technical signals turned negative despite a resilient long-term structure. The current analysis adds a new dimension by highlighting a shift toward upward probabilities driven by improving fundamentals, with the key level to watch now being a breakout above near-term resistance.









-
 Afghanistan
-
 Albania
-
 Algeria
-
 Angola
-
 Argentina
-
 Armenia
-
 Australia
-
 Austria
-
 Azerbaijan
-
 Bahamas
-
 Bahrain
-
 Bangladesh
-
 Belarus
-
 Belgium
-
 Bolivia
-
 Botswana
-
 Brazil
-
 Brunei
-
 Bulgaria
-
 Cambodia
-
 Cameroon
-
 Canada
-
 Chile
Chile
-
 China
China
-
 Colombia
-
 Congo
Congo
-
 Costa Rica
-
 Cote d'Ivoire
-
 Croatia
-
 Cuba
Cuba
-
 Cyprus
-
 Czechia
-
 DR Congo
-
 Denmark
-
 Dominican Republic
-
 Ecuador
-
 Egypt
Egypt
-
 El Salvador
-
 Estonia
-
 Eswatini
-
 Ethiopia
-
 Finland
-
 France
-
 Georgia
-
 Germany
-
 Ghana
Ghana
-
 Greece
-
 Haiti
Haiti
-
 Hong Kong
-
 Hungary
-
 India
India
-
 Indonesia
-
 Iran, Islamic republic
-
 Iraq
Iraq
-
 Ireland
-
 Israel
-
 Italy
Italy
-
 Jamaica
-
 Japan
Japan
-
 Jordan
-
 Kazakhstan
-
 Kenya
Kenya
-
 Korea
Korea
-
 Kuwait
-
 Kyrgyzstan
-
 Laos
Laos
-
 Latvia
-
 Lebanon
-
 Lesotho
-
 Libya
Libya
-
 Lithuania
-
 Luxembourg
-
 Madagascar
-
 Malaysia
-
 Malta
Malta
-
 Mauritius
-
 Mexico
-
 Moldova
-
 Mongolia
-
 Montenegro
-
 Morocco
-
 Mozambique
-
 Myanmar
-
 Namibia
-
 Nepal
Nepal
-
 Netherlands
-
 New Zealand
-
 Nigeria
-
 North Macedonia
-
 Norway
-
 Oman
Oman
-
 Pakistan
-
 Palestine
-
 Panama
-
 Papua New Guinea
-
 Paraguay
-
 Peru
Peru
-
 Philippines
-
 Poland
-
 Portugal
-
 Puerto Rico
-
 Qatar
Qatar
-
 Reunion
-
 Romania
-
 Rwanda
-
 Saudi Arabia
-
 Serbia
-
 Singapore
-
 Slovakia
-
 Slovenia
-
 Somalia
-
 South Africa
-
 Spain
Spain
-
 Sri Lanka
-
 Sweden
-
 Switzerland
-
 Syria
Syria
-
 Taiwan
-
 Tajikistan
-
 Tanzania
-
 Thailand
-
 Trinidad and Tobago
-
 Tunisia
-
 Turkey
-
 UAE
UAE
-
 Uganda
-
 Ukraine
-
 United Kingdom
-
United States
-
 Uruguay
-
 Uzbekistan
-
 Venezuela
-
 Vietnam
-
 Yemen
Yemen
-
 Zambia
-
 Zimbabwe
- Forex
- Crypto












