


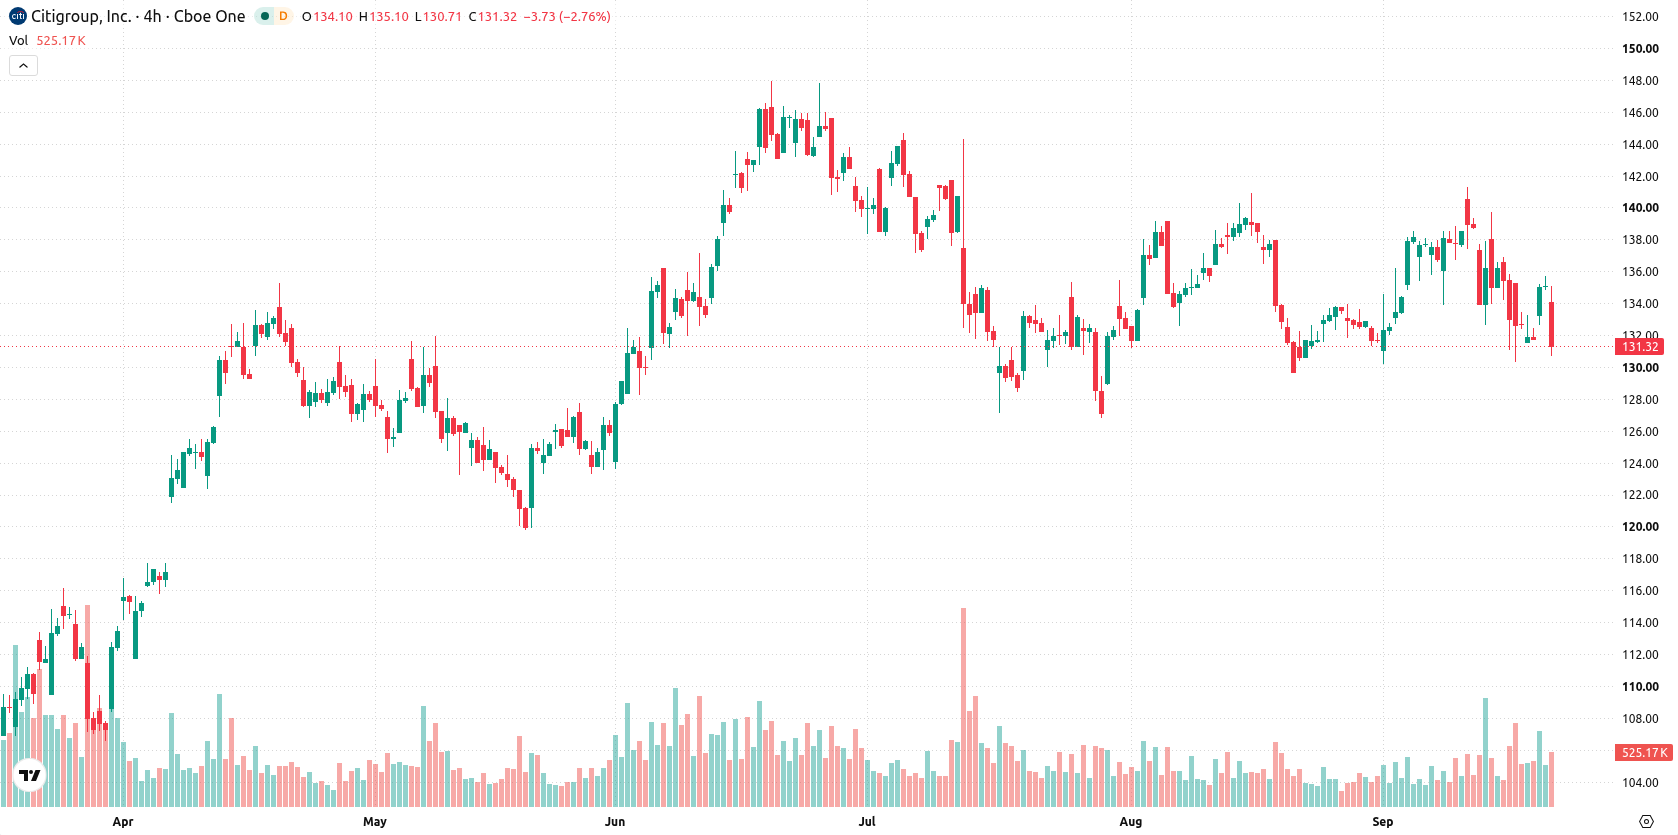
Citigroup Inc. (C) dropped 3.02% as sellers imposed strong short- and medium-term pressure, with the absence of any fresh corporate news acting as a backdrop for the decline. The downtrend is supported by the stock's position below its 20-day and 50-day moving averages, which reinforces the momentum of the current move.
 124.13
133.26
Highlights
- Shares of Citigroup fell 3.02% to $130.98, trading below key short- and medium-term moving averages.
- Mixed momentum indicators show no strong trend, with oscillators projecting underlying demand despite price pressure.
- Predicted range for the next five trading days is $128.07 to $135.23, with resistance at $134.3 and support at $130.45.
Mixed momentum signals as short-term weakness meets long-term support
Citigroup is trading below its 20-day and 50-day moving averages ($134.78 and $134.3 respectively) and remains above its 200-day moving average ($124.93), indicating short- and medium-term pressure from sellers but longer-term bullish structure. The nearest resistance is located at $134.3, with short-term support identified at $130.45. Momentum signals are mixed: MACD and Average Directional Index (ADX) are both neutral, suggesting a lack of clear trend momentum. Relative Strength Index (RSI) sits at 51.45 and projects a buy signal, while Stochastic RSI signals strong buy and Commodity Channel Index (CCI) is neutral, indicating no clear overbought or oversold conditions. Bull/Bear Power (BBP) at 0.85 confirms buyers are dominating intraday momentum, though the indicator is also in overbought territory. The stock declined to $130.98, down $4.08 or 3.02% after a downside gap of about $0.18 (0.13%). Price is near today’s low, with intraday volatility at a subdued 0.57%. The session shows pressure after the open, with some divergence between intraday weakness and oscillators that suggest underlying demand.
Previously it was reported that Citi partnered with DBS to successfully execute a cross-border digital payment outside traditional banking hours, demonstrating the bank's technological innovation in transaction settlement. While recent price action reflects short- and medium-term technical pressure, traders should monitor the $134.3 resistance and $130.45 support as key levels that could determine Citigroup's next directional move.





Latest Citigroup News




-
 Afghanistan
-
 Albania
-
 Algeria
-
 Angola
-
 Argentina
-
 Armenia
-
 Australia
-
 Austria
-
 Azerbaijan
-
 Bahamas
-
 Bahrain
-
 Bangladesh
-
 Belarus
-
 Belgium
-
 Bolivia
-
 Botswana
-
 Brazil
-
 Brunei
-
 Bulgaria
-
 Cambodia
-
 Cameroon
-
 Canada
-
 Chile
-
 China
-
 Colombia
-
 Congo
-
 Costa Rica
-
 Cote d'Ivoire
-
 Croatia
-
 Cuba
-
 Cyprus
-
 Czechia
-
 DR Congo
-
 Denmark
-
 Dominican Republic
-
 Ecuador
-
 Egypt
-
 El Salvador
-
 Estonia
-
 Eswatini
-
 Ethiopia
-
 Finland
-
 France
-
 Georgia
-
 Germany
-
 Ghana
-
 Greece
-
 Haiti
-
 Hong Kong
-
 Hungary
-
 India
-
 Indonesia
-
 Iran, Islamic republic
-
 Iraq
-
 Ireland
-
 Israel
-
 Italy
-
 Jamaica
-
 Japan
-
 Jordan
-
 Kazakhstan
-
 Kenya
-
 Korea
-
 Kuwait
-
 Kyrgyzstan
-
 Laos
-
 Latvia
-
 Lebanon
-
 Lesotho
-
 Libya
-
 Lithuania
-
 Luxembourg
-
 Madagascar
-
 Malaysia
-
 Malta
-
 Mauritius
-
 Mexico
-
 Moldova
-
 Mongolia
-
 Montenegro
-
 Morocco
-
 Mozambique
-
 Myanmar
-
 Namibia
-
 Nepal
-
 Netherlands
-
 New Zealand
-
 Nigeria
-
 North Macedonia
-
 Norway
-
 Oman
-
 Pakistan
-
 Palestine
-
 Panama
-
 Papua New Guinea
-
 Paraguay
-
 Peru
-
 Philippines
-
 Poland
-
 Portugal
-
 Puerto Rico
-
 Qatar
-
 Reunion
-
 Romania
-
 Rwanda
-
 Saudi Arabia
-
 Serbia
-
 Singapore
-
 Slovakia
-
 Slovenia
-
 Somalia
-
 South Africa
-
 Spain
-
 Sri Lanka
-
 Sweden
-
 Switzerland
-
 Syria
-
 Taiwan
-
 Tajikistan
-
 Tanzania
-
 Thailand
-
 Trinidad and Tobago
-
 Tunisia
-
 Turkey
-
 UAE
-
 Uganda
-
 Ukraine
-
 United Kingdom
-
United States
-
 Uruguay
-
 Uzbekistan
-
 Venezuela
-
 Vietnam
-
 Yemen
-
 Zambia
-
 Zimbabwe
- Forex
- Crypto












