

RTX shares drop almost 2% after bearish momentum sweeps through all key indicators

Technical selling pressure drove RTX Corporation (RTX) down 1.97% today, as downside momentum weighed on the stock across all timeframes. The decline is supported by RTX trading below its 20-day, 50-day, and 200-day moving averages, with sellers dominating price action and momentum indicators showing bearish signals.
 204.01
Highlights
- Shares of RTX trade below key moving averages, indicating sustained selling pressure across all monitored timeframes.
- Bearish momentum remains in force, with multiple oscillators approaching oversold readings and sellers dominating intraday trading.
- For the next five days, the expected price range is $187.28 to $193.73 with a 76% probability of further downside.
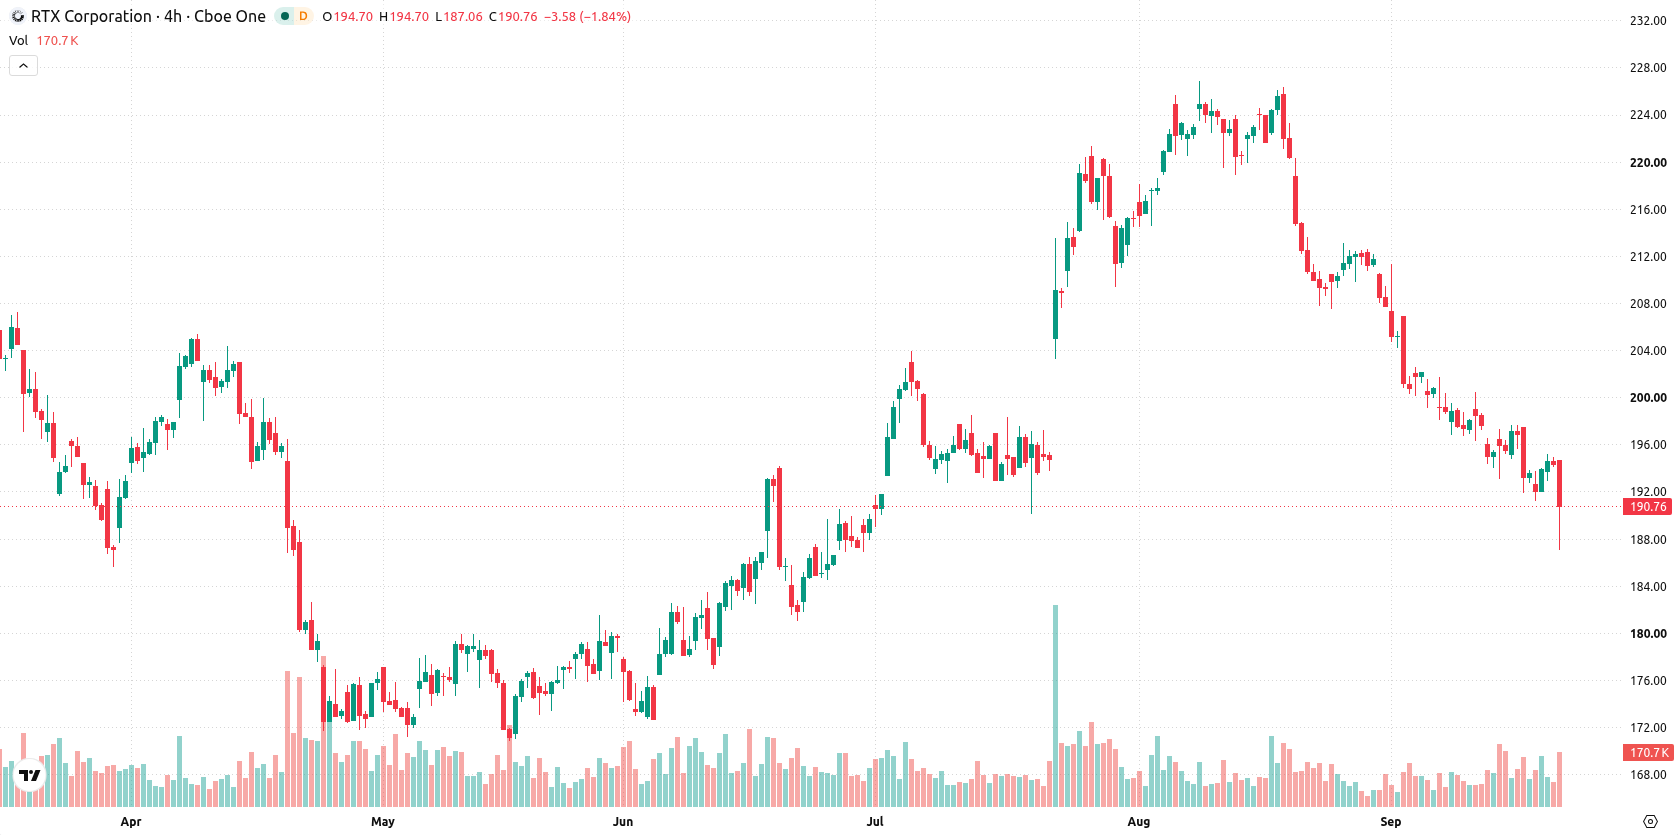
Bearish momentum persists as price nears oversold amid broad technical weakness
RTX is trading below its 20-day, 50-day, and 200-day moving averages at $201.67, $208.02, and $194.29 respectively, indicating sustained pressure from sellers across all timeframes. The nearest resistance stands at $191.22 with near-term support at $187.28, and the long-term trend remains bullish as the alignment of the 50-day average is above the 200-day. Momentum signals from the MACD and ADX are bearish, reflecting prevailing downside pressure. The RSI, CCI, and Stochastic RSI all suggest the stock is approaching or testing oversold territory, though the Stochastic RSI is neutral. Sellers clearly dominate intraday price action as indicated by the negative Bull/Bear Power (BBP) value and its oversold reading. RTX has dropped $3.835 or 1.97% today after opening with a downside gap of approximately 0.48%. The price is near the session low and intraday volatility stands at 1.15%. The overall intraday tone is weak with sellers exerting control early in the session, consistent with bearish momentum signals.
Previously it was reported that RTX was consolidating at key support levels, with technical signals favoring potential stabilization. The latest decline confirms persistent selling pressure, and with downside momentum prevailing, traders should monitor $187.28 as the immediate support level where a break could prompt further weakness.










-
 Afghanistan
-
 Albania
-
 Algeria
-
 Angola
-
 Argentina
-
 Armenia
-
 Australia
-
 Austria
-
 Azerbaijan
-
 Bahamas
-
 Bahrain
-
 Bangladesh
-
 Belarus
-
 Belgium
-
 Bolivia
-
 Botswana
-
 Brazil
-
 Brunei
-
 Bulgaria
-
 Cambodia
-
 Cameroon
-
 Canada
-
 Chile
-
 China
-
 Colombia
-
 Congo
-
 Costa Rica
-
 Cote d'Ivoire
-
 Croatia
-
 Cuba
-
 Cyprus
-
 Czechia
-
 DR Congo
-
 Denmark
-
 Dominican Republic
-
 Ecuador
-
 Egypt
-
 El Salvador
-
 Estonia
-
 Eswatini
-
 Ethiopia
-
 Finland
-
 France
-
 Georgia
-
 Germany
-
 Ghana
-
 Greece
-
 Haiti
-
 Hong Kong
-
 Hungary
-
 India
-
 Indonesia
-
 Iran, Islamic republic
-
 Iraq
-
 Ireland
-
 Israel
-
 Italy
-
 Jamaica
-
 Japan
-
 Jordan
-
 Kazakhstan
-
 Kenya
-
 Korea
-
 Kuwait
-
 Kyrgyzstan
-
 Laos
-
 Latvia
-
 Lebanon
-
 Lesotho
-
 Libya
-
 Lithuania
-
 Luxembourg
-
 Madagascar
-
 Malaysia
-
 Malta
-
 Mauritius
-
 Mexico
-
 Moldova
-
 Mongolia
-
 Montenegro
-
 Morocco
-
 Mozambique
-
 Myanmar
-
 Namibia
-
 Nepal
-
 Netherlands
-
 New Zealand
-
 Nigeria
-
 North Macedonia
-
 Norway
-
 Oman
-
 Pakistan
-
 Palestine
-
 Panama
-
 Papua New Guinea
-
 Paraguay
-
 Peru
-
 Philippines
-
 Poland
-
 Portugal
-
 Puerto Rico
-
 Qatar
-
 Reunion
-
 Romania
-
 Rwanda
-
 Saudi Arabia
-
 Serbia
-
 Singapore
-
 Slovakia
-
 Slovenia
-
 Somalia
-
 South Africa
-
 Spain
-
 Sri Lanka
-
 Sweden
-
 Switzerland
-
 Syria
-
 Taiwan
-
 Tajikistan
-
 Tanzania
-
 Thailand
-
 Trinidad and Tobago
-
 Tunisia
-
 Turkey
-
 UAE
-
 Uganda
-
 Ukraine
-
 United Kingdom
-
United States
-
 Uruguay
-
 Uzbekistan
-
 Venezuela
-
 Vietnam
-
 Yemen
-
 Zambia
-
 Zimbabwe
- Forex
- Crypto












