

Expedia shares technical analysis: Holding above $251.21 support

Expedia (EXPE) stock is trading at $263.14, posting a sharp decline of 6.26% on the session. The stock currently sits below its key short- and medium-term moving averages but remains above longer-term support levels.
 286.36
289.97
Highlights
- Expedia Group reported second quarter revenue up 14% year over year to $4.3 billion and adjusted EPS of $5.76, both above consensus.
- The company announced a partnership with Meta's Muse for AI-enabled booking and began integrating travel insurance through Redion.
- Shares of Expedia stock dropped 6.26% and trade below key short- and medium-term averages, with technicals signaling bearish conditions and a $251.21 to $280.09 forecast range.
Earnings beat expectations as sector headwinds drive cautious sentiment
Expedia Group reported a 14% year-over-year increase in revenue to $4.3 billion for the second quarter of 2026, with adjusted EPS of $5.76, both figures exceeding consensus estimates and highlighting strong operational performance, according to Seekingalpha. This robust earnings result signals resilience in Expedia's core business lines, even as the travel sector contends with structural challenges. Recent announcements also include a strategic partnership with Meta's Muse, designed to broaden platform reach through AI-enabled booking, and a marketing collaboration with Redion to integrate travel insurance solutions. While these developments underscore positive momentum in product innovation and financials, price action has remained under broader selling pressure.
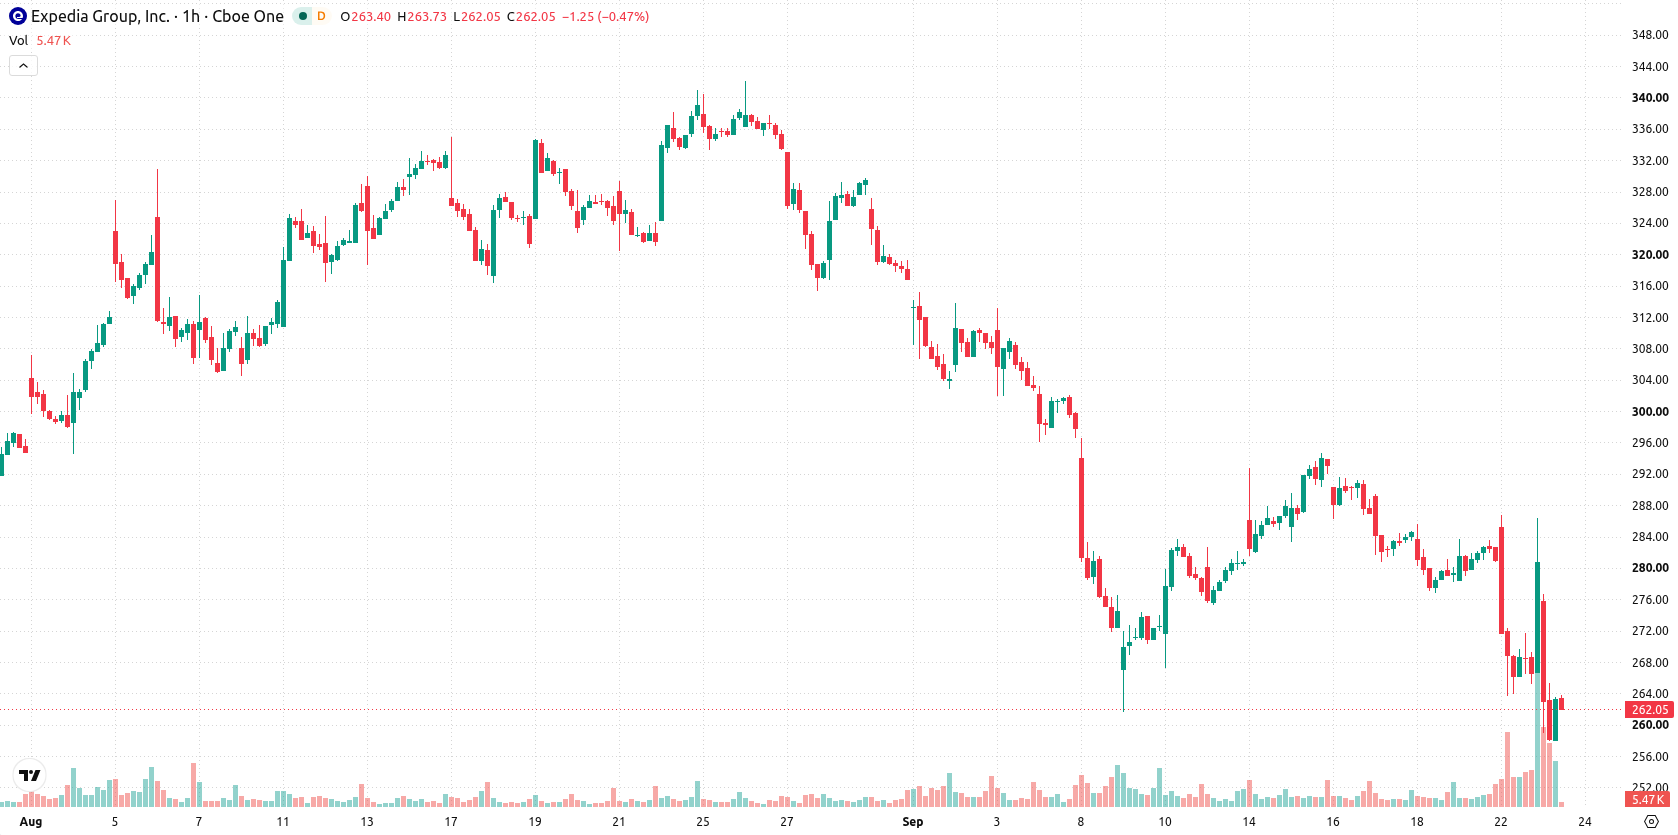
Bearish bias intensifies as mixed indicators converge at volatility lows
On the H1 timeframe, EXPE is trading below the MA-20 at $275.36 and the MA-50 at $282.16, with support from the MA-200 at $260.35. The Ichimoku Kijun line at $272.87 marks the nearest resistance for any rebound attempt. Momentum signals are mixed: MACD points to Sell, while ADX is Neutral, reflecting a lack of clear trend direction. RSI is at 37.08, indicating a selling bias; CCI and Bull/Bear Power both highlight oversold conditions, and both Stoch RSI and Awesome Oscillator remain Neutral. The session saw a sharp 6.26% drop and a $4.95 gap down, with EXPE trading near intraday lows amid high volatility.
Sideways trend likely as resistance caps upside and downside risks persist
Over the next 2–3 days, EXPE is expected to trade within the $251.21 to $280.09 range, in line with typical volatility bands for the period. The base case is for sideways movement within this range. A bullish breakout requires a close above resistance at $272.87, while a move below the $251.21 support band would open the door for further downside. Probability remains tilted toward continued weakness, with an upside reversal considered unlikely unless resistance is decisively reclaimed.
Earlier, analysts noted that Expedia was facing ongoing technical pressure despite positive company initiatives and institutional interest. The current article adds that, in the near term, traders should monitor the $272.87 resistance as a critical threshold, as a failure to reclaim it would likely keep the stock confined to a lower trading range with continued downside risk.






Latest Expedia Inc News




-
 Afghanistan
-
 Albania
-
 Algeria
-
 Angola
-
 Argentina
-
 Armenia
-
 Australia
-
 Austria
-
 Azerbaijan
-
 Bahamas
-
 Bahrain
-
 Bangladesh
-
 Belarus
-
 Belgium
-
 Bolivia
-
 Botswana
-
 Brazil
-
 Brunei
-
 Bulgaria
-
 Cambodia
-
 Cameroon
-
 Canada
-
 Chile
-
 China
-
 Colombia
-
 Congo
-
 Costa Rica
-
 Cote d'Ivoire
-
 Croatia
-
 Cuba
-
 Cyprus
-
 Czechia
-
 DR Congo
-
 Denmark
-
 Dominican Republic
-
 Ecuador
-
 Egypt
-
 El Salvador
-
 Estonia
-
 Eswatini
-
 Ethiopia
-
 Finland
-
 France
-
 Georgia
-
 Germany
-
 Ghana
-
 Greece
-
 Haiti
-
 Hong Kong
-
 Hungary
-
 India
-
 Indonesia
-
 Iran, Islamic republic
-
 Iraq
-
 Ireland
-
 Israel
-
 Italy
-
 Jamaica
-
 Japan
-
 Jordan
-
 Kazakhstan
-
 Kenya
-
 Korea
-
 Kuwait
-
 Kyrgyzstan
-
 Laos
-
 Latvia
-
 Lebanon
-
 Lesotho
-
 Libya
-
 Lithuania
-
 Luxembourg
-
 Madagascar
-
 Malaysia
-
 Malta
-
 Mauritius
-
 Mexico
-
 Moldova
-
 Mongolia
-
 Montenegro
-
 Morocco
-
 Mozambique
-
 Myanmar
-
 Namibia
-
 Nepal
-
 Netherlands
-
 New Zealand
-
 Nigeria
-
 North Macedonia
-
 Norway
-
 Oman
-
 Pakistan
-
 Palestine
-
 Panama
-
 Papua New Guinea
-
 Paraguay
-
 Peru
-
 Philippines
-
 Poland
-
 Portugal
-
 Puerto Rico
-
 Qatar
-
 Reunion
-
 Romania
-
 Rwanda
-
 Saudi Arabia
-
 Serbia
-
 Singapore
-
 Slovakia
-
 Slovenia
-
 Somalia
-
 South Africa
-
 Spain
-
 Sri Lanka
-
 Sweden
-
 Switzerland
-
 Syria
-
 Taiwan
-
 Tajikistan
-
 Tanzania
-
 Thailand
-
 Trinidad and Tobago
-
 Tunisia
-
 Turkey
-
 UAE
-
 Uganda
-
 Ukraine
-
 United Kingdom
-
United States
-
 Uruguay
-
 Uzbekistan
-
 Venezuela
-
 Vietnam
-
 Yemen
-
 Zambia
-
 Zimbabwe
- Forex
- Crypto












