

Expedia shares technical analysis: Downward price move and weak momentum

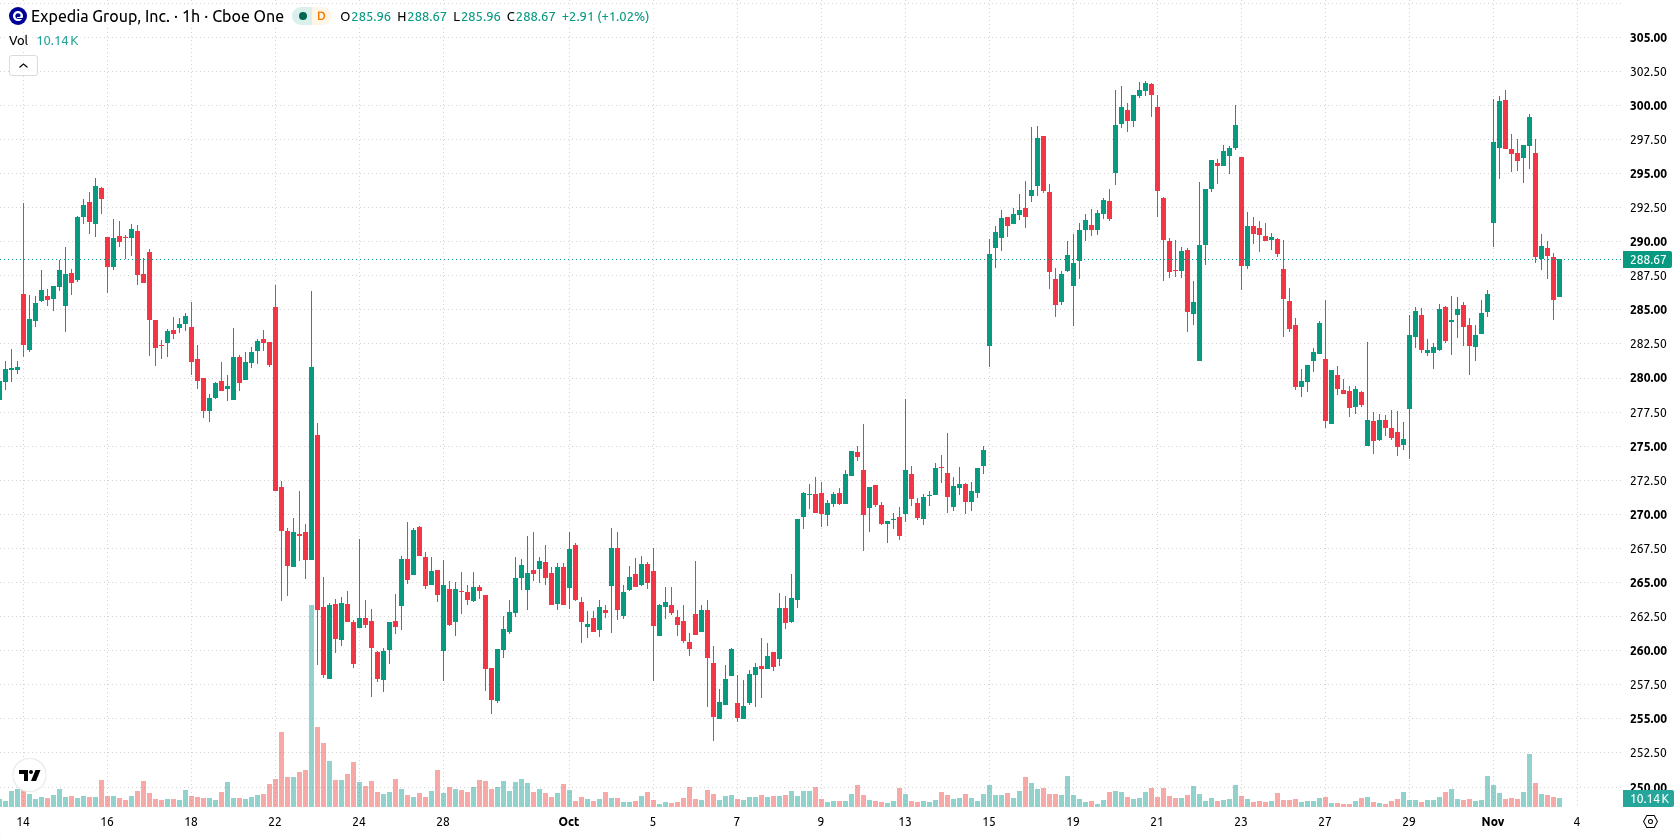
Expedia (EXPE) stock is trading at $288, marking a daily decline of 3.7%. The price finished near the session's low, positioned below its short-term moving average but above the intermediate and long-term trend benchmarks.
 274.81
326.00
Highlights
- Expedia Group launched over 30 AI-powered features across its major platforms in October 2026, enhancing digital user experience.
- The company is scheduled to announce third-quarter earnings on November 4, 2026, which may prompt portfolio changes.
- Shares of Expedia Group closed at $288, down 3.7% with ongoing selling pressure, as technical indicators suggest a 50% probability for either a move to $276.13 or $299.87, indicating likely near-term consolidation.
Product expansion and earnings anticipation steer sentiment under selling pressure
Expedia Group introduced more than 30 artificial intelligence-led features across Expedia, Hotels.com, and Vrbo in late October 2026, broadening digital capabilities and enhancing the user experience, according to Simplywall and Travel Yahoo. This product rollout may strengthen the company's competitive position as customers access new itinerary tools, natural language search, and property onboarding enhancements. Attention has also turned to the company's scheduled release of third-quarter earnings on November 4, 2026, as reported by Stockstory, which may drive portfolio adjustments as results are announced. Despite these corporate developments, price action has remained under broader selling pressure.
Support holds as mixed momentum signals curb directional bias
The stock closed at $288 after moving below the MA-20 but holding above the MA-50 on the hourly chart and remaining above the MA-200 on the daily timeframe. The Ichimoku Kijun level at $287.54 currently acts as immediate support. Among momentum indicators, MACD and ADX both suggest underlying buyer strength, while RSI, Stochastic RSI, and CCI each register in the neutral zone, indicating a lack of clear directional momentum. Bull/Bear Power registers a positive value of 5.19, hinting at intraday buyer control, while the Awesome Oscillator remains neutral and does not actively confirm the prevailing bias.
Range-bound outlook prevails as breakout triggers remain distant
In the near term, price is likely to fluctuate between $276.13 and $299.87, with an evenly balanced probability for either upward or downward movement. Typical volatility suggests sideways consolidation unless either support or resistance is decisively breached. A break above the upper boundary may prompt a bullish breakout, while a drop below $276.13 could accelerate downside momentum.
Previously it was reported that Expedia shares experienced short-term pressure despite strong earnings and significant AI-driven product launches, as profit-taking and mixed technical signals limited rebound potential. The current analysis adds a near-term focus on price consolidation between $276.13 and $299.87, with traders advised to monitor for a decisive move beyond these boundaries as a signal for the next directional trend.










-
 Afghanistan
-
 Albania
-
 Algeria
-
 Angola
-
 Argentina
-
 Armenia
-
 Australia
-
 Austria
-
 Azerbaijan
-
 Bahamas
-
 Bahrain
-
 Bangladesh
-
 Belarus
-
 Belgium
-
 Bolivia
-
 Botswana
-
 Brazil
-
 Brunei
-
 Bulgaria
-
 Cambodia
-
 Cameroon
-
 Canada
-
 Chile
-
 China
-
 Colombia
-
 Congo
-
 Costa Rica
-
 Cote d'Ivoire
-
 Croatia
-
 Cuba
-
 Cyprus
-
 Czechia
-
 DR Congo
-
 Denmark
-
 Dominican Republic
-
 Ecuador
-
 Egypt
-
 El Salvador
-
 Estonia
-
 Eswatini
-
 Ethiopia
-
 Finland
-
 France
-
 Georgia
-
 Germany
-
 Ghana
-
 Greece
-
 Haiti
-
 Hong Kong
-
 Hungary
-
 India
-
 Indonesia
-
 Iran, Islamic republic
-
 Iraq
-
 Ireland
-
 Israel
-
 Italy
-
 Jamaica
-
 Japan
-
 Jordan
-
 Kazakhstan
-
 Kenya
-
 Korea
-
 Kuwait
-
 Kyrgyzstan
-
 Laos
-
 Latvia
-
 Lebanon
-
 Lesotho
-
 Libya
-
 Lithuania
-
 Luxembourg
-
 Madagascar
-
 Malaysia
-
 Malta
-
 Mauritius
-
 Mexico
-
 Moldova
-
 Mongolia
-
 Montenegro
-
 Morocco
-
 Mozambique
-
 Myanmar
-
 Namibia
-
 Nepal
-
 Netherlands
-
 New Zealand
-
 Nigeria
-
 North Macedonia
-
 Norway
-
 Oman
-
 Pakistan
-
 Palestine
-
 Panama
-
 Papua New Guinea
-
 Paraguay
-
 Peru
-
 Philippines
-
 Poland
-
 Portugal
-
 Puerto Rico
-
 Qatar
-
 Reunion
-
 Romania
-
 Rwanda
-
 Saudi Arabia
-
 Serbia
-
 Singapore
-
 Slovakia
-
 Slovenia
-
 Somalia
-
 South Africa
-
 Spain
-
 Sri Lanka
-
 Sweden
-
 Switzerland
-
 Syria
-
 Taiwan
-
 Tajikistan
-
 Tanzania
-
 Thailand
-
 Trinidad and Tobago
-
 Tunisia
-
 Turkey
-
 UAE
-
 Uganda
-
 Ukraine
-
 United Kingdom
-
United States
-
 Uruguay
-
 Uzbekistan
-
 Venezuela
-
 Vietnam
-
 Yemen
-
 Zambia
-
 Zimbabwe
- Forex
- Crypto












