

CBRE shares technical analysis: Support test at $133.53

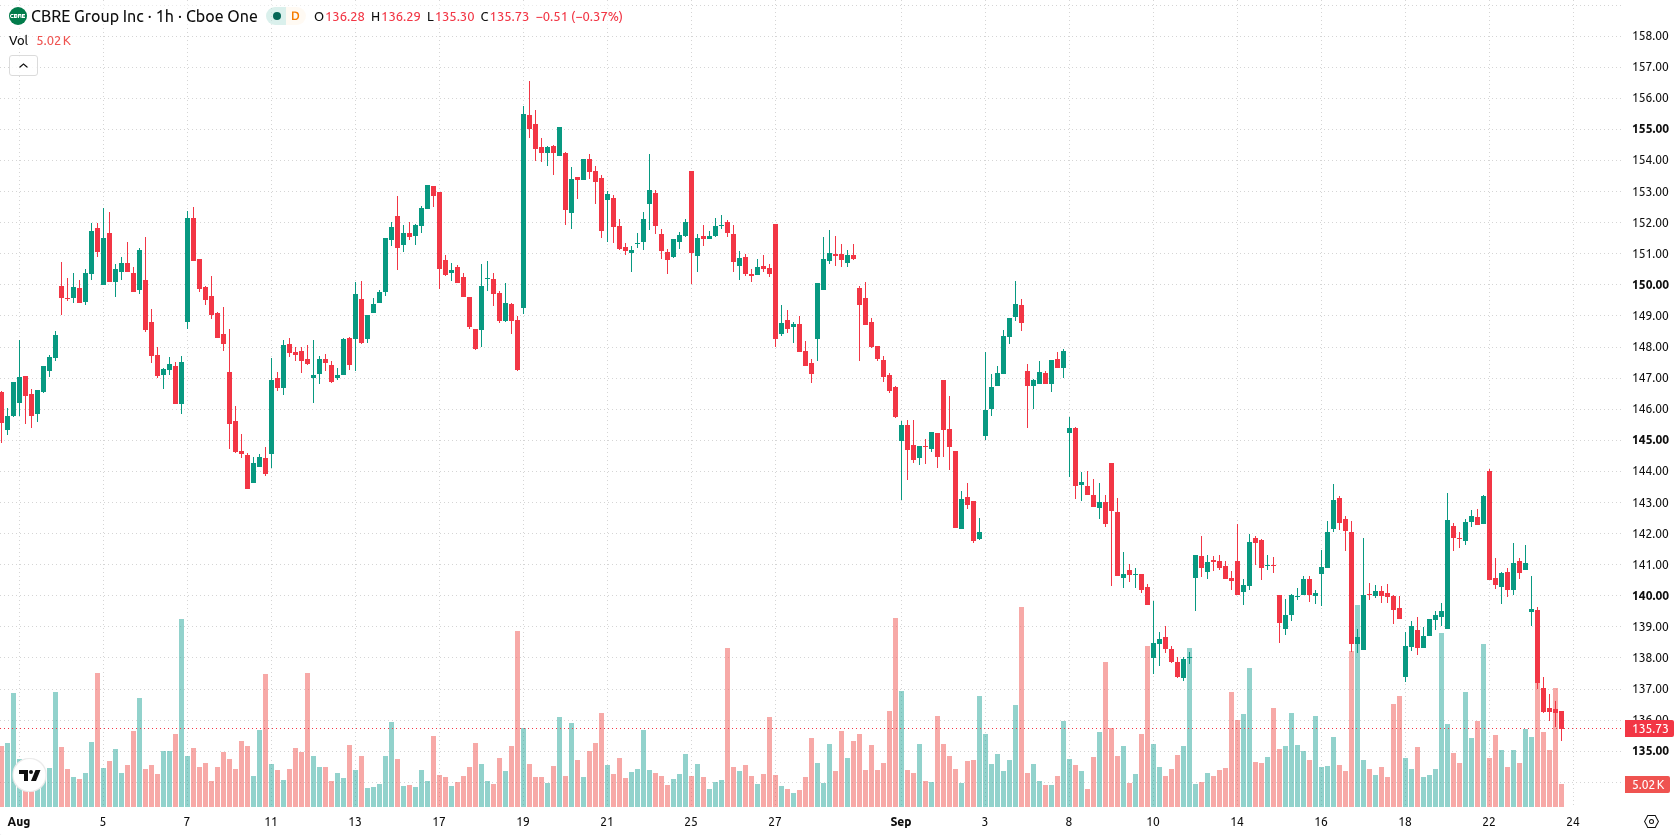
CBRE Group Inc. (CBRE) stock is trading at $136.45 after falling 3.26% for the day. The price remains below its key moving averages, indicating sustained near-term and longer-term selling momentum.
 130.97
Highlights
- CBRE Investment Management has acquired Tenet Equity and added a $1.6 billion fully leased real estate portfolio across 39 states.
- The transaction expands CBRE's managed assets, increases recurring rental income, and establishes a platform for future sale-leaseback investments.
- Shares of CBRE dropped 3.26% to $136.45 with technical indicators in heavily oversold territory and likely to remain rangebound between $133.53 and $139.37 over the next several days.
Asset base expansion and revenue diversification as new strategy launches
CBRE Investment Management completed the acquisition of Tenet Equity and introduced a new triple net lease investment strategy, incorporating a fully leased $1.6 billion real estate portfolio spanning 39 states, according to Pulse2. This transaction immediately expands CBRE's managed asset base and diversifies its revenue sources by increasing recurring rental income. The establishment of a dedicated platform for future sale-leaseback investments increases flexibility for growth in targeted real estate segments, though price action has remained under broader selling pressure.
Oversold signals and weak momentum as price lags major resistance
On the hourly timeframe, CBRE trades below the MA-20 at $140.66, MA-50 at $140.39, and well under the MA-200 at $146.21. Resistance is presented by the Ichimoku Kijun at $140.18. MACD is issuing a Sell signal, while ADX is Neutral, indicating weak momentum and no clear directional trend. RSI stands at 31.59 (Sell), with both Stochastic RSI and CCI registering Oversold, as well as Bull/Bear Power in Oversold territory, underlining strong seller dominance intraday. The Awesome Oscillator remains Neutral and does not currently reinforce the prevailing trend.
Further downside likely amid limited probability for reversal
Over the next two to three trading days, CBRE is likely to trade within a volatility band of $133.53 to $139.37. The probability of a price increase is considered very low, while a further decline is highly probable. The baseline scenario anticipates range-bound, sideways trading within these levels; a decisive breakout above $140.18 would be needed for any bullish momentum to develop, while a move below $133.53 could open the way for deeper lows.
Previously it was reported that changes to asset listings and trading resumption in India's capital markets would broaden investor access and restore market participation across sectors. The addition of CBRE's new triple net lease platform now introduces further diversification and risk exposure, making sustained monitoring of the $133.53 support level crucial as volatility persists.






Latest CBRE Group Inc News





-
 Afghanistan
-
 Albania
-
 Algeria
-
 Angola
-
 Argentina
-
 Armenia
-
 Australia
-
 Austria
-
 Azerbaijan
-
 Bahamas
-
 Bahrain
-
 Bangladesh
-
 Belarus
-
 Belgium
-
 Bolivia
-
 Botswana
-
 Brazil
-
 Brunei
-
 Bulgaria
-
 Cambodia
-
 Cameroon
-
 Canada
-
 Chile
-
 China
-
 Colombia
-
 Congo
-
 Costa Rica
-
 Cote d'Ivoire
-
 Croatia
-
 Cuba
-
 Cyprus
-
 Czechia
-
 DR Congo
-
 Denmark
-
 Dominican Republic
-
 Ecuador
-
 Egypt
-
 El Salvador
-
 Estonia
-
 Eswatini
-
 Ethiopia
-
 Finland
-
 France
-
 Georgia
-
 Germany
-
 Ghana
-
 Greece
-
 Haiti
-
 Hong Kong
-
 Hungary
-
 India
-
 Indonesia
-
 Iran, Islamic republic
-
 Iraq
-
 Ireland
-
 Israel
-
 Italy
-
 Jamaica
-
 Japan
-
 Jordan
-
 Kazakhstan
-
 Kenya
-
 Korea
-
 Kuwait
-
 Kyrgyzstan
-
 Laos
-
 Latvia
-
 Lebanon
-
 Lesotho
-
 Libya
-
 Lithuania
-
 Luxembourg
-
 Madagascar
-
 Malaysia
-
 Malta
-
 Mauritius
-
 Mexico
-
 Moldova
-
 Mongolia
-
 Montenegro
-
 Morocco
-
 Mozambique
-
 Myanmar
-
 Namibia
-
 Nepal
-
 Netherlands
-
 New Zealand
-
 Nigeria
-
 North Macedonia
-
 Norway
-
 Oman
-
 Pakistan
-
 Palestine
-
 Panama
-
 Papua New Guinea
-
 Paraguay
-
 Peru
-
 Philippines
-
 Poland
-
 Portugal
-
 Puerto Rico
-
 Qatar
-
 Reunion
-
 Romania
-
 Rwanda
-
 Saudi Arabia
-
 Serbia
-
 Singapore
-
 Slovakia
-
 Slovenia
-
 Somalia
-
 South Africa
-
 Spain
-
 Sri Lanka
-
 Sweden
-
 Switzerland
-
 Syria
-
 Taiwan
-
 Tajikistan
-
 Tanzania
-
 Thailand
-
 Trinidad and Tobago
-
 Tunisia
-
 Turkey
-
 UAE
-
 Uganda
-
 Ukraine
-
 United Kingdom
-
United States
-
 Uruguay
-
 Uzbekistan
-
 Venezuela
-
 Vietnam
-
 Yemen
-
 Zambia
-
 Zimbabwe
- Forex
- Crypto












