

Xylem stock slides more than 3% after bearish technical signals counter solid Q2 earnings

Xylem Inc (XYL) fell 3.21% after early selling pressure dominated, even as a recent increase in institutional holdings and solid second-quarter earnings shaped the fundamental backdrop. The bearish quality of today's move is supported by the stock remaining below its 20-day, 50-day, and 200-day moving averages.
 100.80
97.52
Highlights
- State Street increased its stake in Xylem by 2.4% in the second quarter, holding over 11.4 million shares.
- Xylem reported second-quarter earnings per share up 16% to $1.46 and annual revenue growth of 1%.
- Xylem stock trades below major moving averages with persistent selling pressure and a projected five-day range of $103.93 to $106.72.
Large holding increase and earnings strength countered by sectorwide pressure
State Street Corp increased its holding in Xylem by 2.4% in the second quarter, according to an SEC filing, bringing its total to over 11.4 million shares. Xylem reported a 16% rise in second-quarter earnings per share to $1.46 and a 1% year-over-year revenue increase. The company continues to be recognized for its global water infrastructure and management solutions, with investors closely monitoring the water sector for impacts from regulation and government contracts, though price action has remained under broader selling pressure.
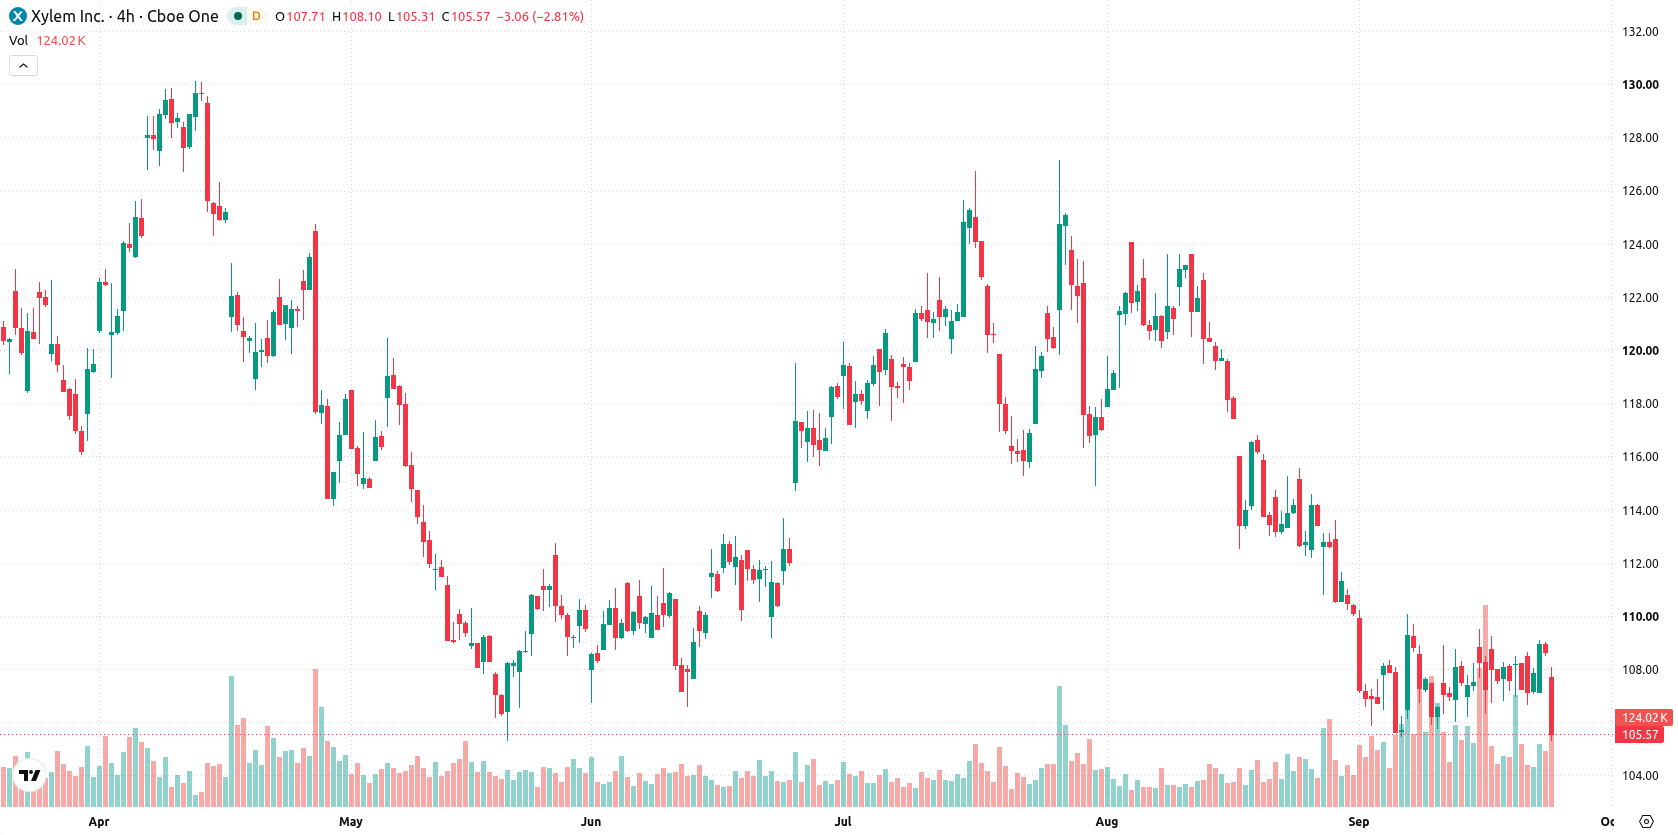
Extended lows and negative momentum as multiple indicators turn bearish
Xylem is trading below the 20-day, 50-day, and 200-day moving averages, with prices at $108.3, $114.79, and $122.29, respectively. This configuration highlights selling pressure on short-, medium-, and long-term horizons and anchors a bearish longer-term trend. Attention centers on resistance at $106.65 and support at $103.93. Momentum signals are broadly negative, with the MACD flagging 'Strong Sell' and the ADX neutral. The RSI is at 44.32, indicating subdued momentum with a 'Sell' signal, while the Stochastic RSI is at 100, highlighting overbought short-term conditions. The CCI and Awesome Oscillator are neutral. Bull/Bear Power stands at 0.96, showing intraday buying with an overbought flag. The stock was down $3.49, or 3.21%, with intraday volatility at 1.96% and early session downside pressure prevailing.
In a recent review, analysts noted that Xylem maintained a neutral-to-moderately positive short-term outlook supported by ongoing dividend growth and mixed quarterly earnings. The current technical setup shifts the focus to downside risks, with monitoring of the $103.93 support level essential for gauging the potential for further declines in the days ahead.









-
 Afghanistan
-
 Albania
-
 Algeria
-
 Angola
-
 Argentina
-
 Armenia
-
 Australia
-
 Austria
-
 Azerbaijan
-
 Bahamas
-
 Bahrain
-
 Bangladesh
-
 Belarus
-
 Belgium
-
 Bolivia
-
 Botswana
-
 Brazil
-
 Brunei
-
 Bulgaria
-
 Cambodia
-
 Cameroon
-
 Canada
-
 Chile
-
 China
-
 Colombia
-
 Congo
-
 Costa Rica
-
 Cote d'Ivoire
-
 Croatia
-
 Cuba
-
 Cyprus
-
 Czechia
-
 DR Congo
-
 Denmark
-
 Dominican Republic
-
 Ecuador
-
 Egypt
-
 El Salvador
-
 Estonia
-
 Eswatini
-
 Ethiopia
-
 Finland
-
 France
-
 Georgia
-
 Germany
-
 Ghana
-
 Greece
-
 Haiti
-
 Hong Kong
-
 Hungary
-
 India
-
 Indonesia
-
 Iran, Islamic republic
-
 Iraq
-
 Ireland
-
 Israel
-
 Italy
-
 Jamaica
-
 Japan
-
 Jordan
-
 Kazakhstan
-
 Kenya
-
 Korea
-
 Kuwait
-
 Kyrgyzstan
-
 Laos
-
 Latvia
-
 Lebanon
-
 Lesotho
-
 Libya
-
 Lithuania
-
 Luxembourg
-
 Madagascar
-
 Malaysia
-
 Malta
-
 Mauritius
-
 Mexico
-
 Moldova
-
 Mongolia
-
 Montenegro
-
 Morocco
-
 Mozambique
-
 Myanmar
-
 Namibia
-
 Nepal
-
 Netherlands
-
 New Zealand
-
 Nigeria
-
 North Macedonia
-
 Norway
-
 Oman
-
 Pakistan
-
 Palestine
-
 Panama
-
 Papua New Guinea
-
 Paraguay
-
 Peru
-
 Philippines
-
 Poland
-
 Portugal
-
 Puerto Rico
-
 Qatar
-
 Reunion
-
 Romania
-
 Rwanda
-
 Saudi Arabia
-
 Serbia
-
 Singapore
-
 Slovakia
-
 Slovenia
-
 Somalia
-
 South Africa
-
 Spain
-
 Sri Lanka
-
 Sweden
-
 Switzerland
-
 Syria
-
 Taiwan
-
 Tajikistan
-
 Tanzania
-
 Thailand
-
 Trinidad and Tobago
-
 Tunisia
-
 Turkey
-
 UAE
-
 Uganda
-
 Ukraine
-
 United Kingdom
-
United States
-
 Uruguay
-
 Uzbekistan
-
 Venezuela
-
 Vietnam
-
 Yemen
-
 Zambia
-
 Zimbabwe
- Forex
- Crypto












