

Why is CME Group stock down today? Key support levels to watch

CME Group (CME) stock is trading at $260.59, marking a 3.1% decline since the previous session and closing near the session low. The stock finished the day below its key moving averages, reflecting a loss of short-term momentum relative to recent trading levels.
 307.99
311.71
Highlights
- CME Group stock achieved a 70.3% price gain over five years and averaged 16.22% return on equity, indicating sustained operational strength.
- Despite this strong historical performance, shares of CME Group have recently traded under broad selling pressure.
- CME Group stock now trades below key moving averages, with technical signals skewed bearish and a very high probability of remaining within the $255.82 to $270.59 range.
Long-term outperformance persists as price faces sector-wide selling
CME Group has recorded a 70.3% share price gain over the past five years, marking substantial historical outperformance in the exchange sector. According to Simplywall, the company has also maintained an average return on equity of 16.22% during this period, reflecting consistent operational effectiveness. While these factors highlight a long-standing track record of stability and profitability, price action has remained under broader selling pressure.
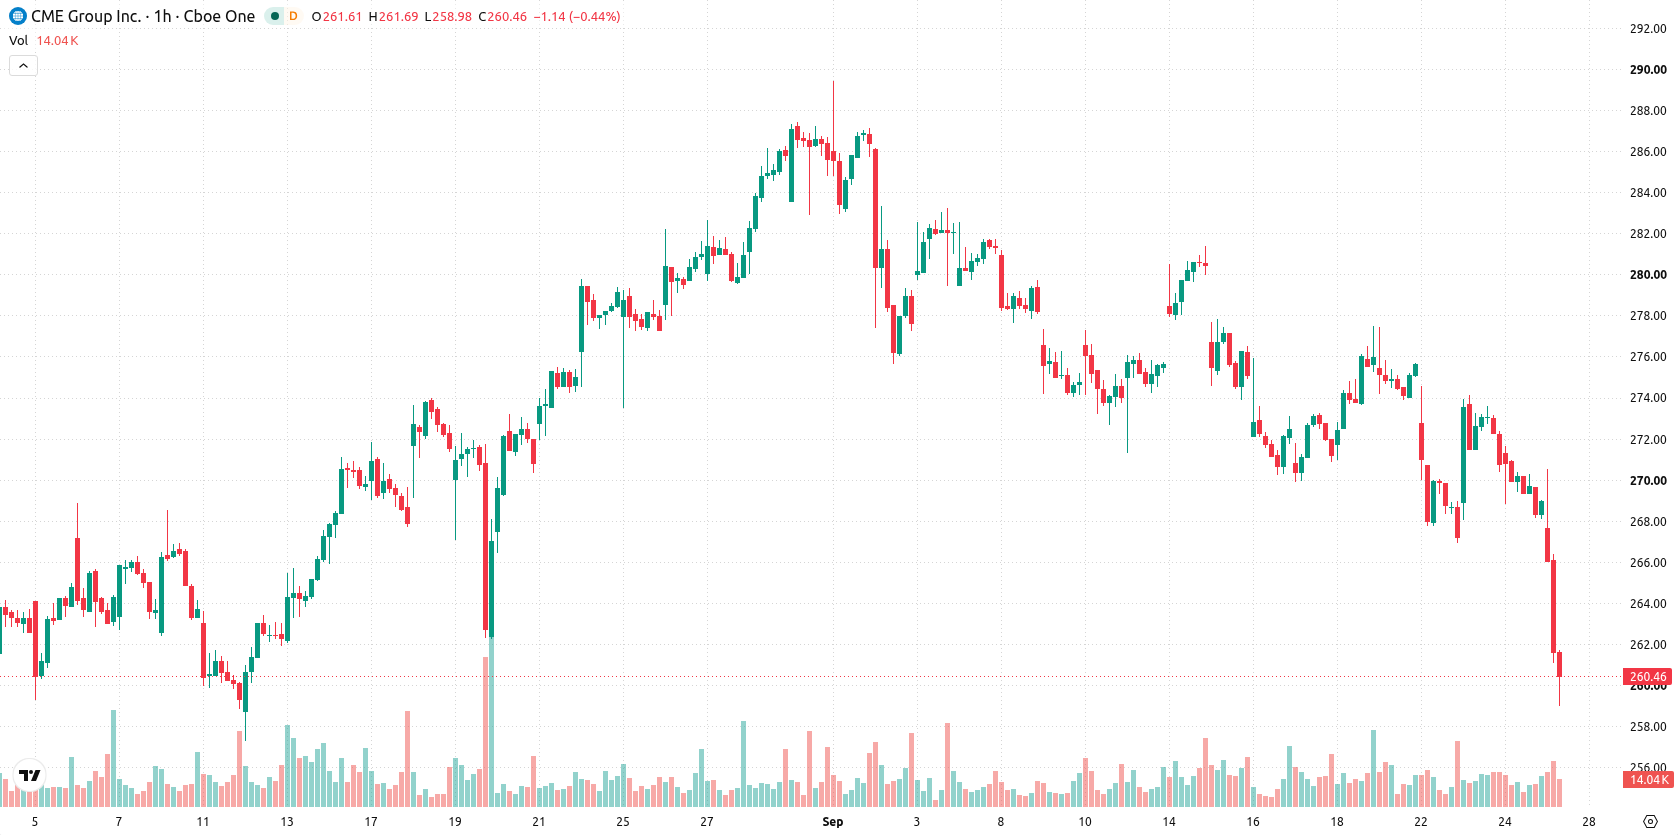
Bearish momentum dominates as divergences emerge across technicals
CME has broken below its MA-20 at $270.41 and MA-50 at $271.99, with price action also falling short of the long-term MA-200 at $278.64. The Ichimoku Kijun at $271.32 emerges as immediate resistance for any rebound attempts. Momentum signals remain mostly bearish, as both MACD and ADX indicate a sell bias; RSI sits at 43.46, within the sell zone. Stoch RSI offers a contrasting strong buy signal and CCI reads neutral, presenting marked divergence among oscillators. Bull/Bear Power is classified as overbought, hinting at intraday buying strength that is contradicted by weak price action, while the Awesome Oscillator stays neutral.
Sideways bias prevails as downside risk overshadows rebound prospects
For the coming sessions, CME is expected to fluctuate within a typical volatility range of $255.82 to $270.59. The baseline scenario envisions sideways movement in this corridor. A bullish case would require a momentum-driven break above resistance at $271.32, signaling a potential short-term turnaround. If the $255.82 support is breached, a more pronounced decline could follow, as the probability of further downward movement is assessed as high while the chance of a reversal is very low.
Earlier, analysts noted that CME Group shares had reclaimed a significant technical level while the firm pursued expansion of its derivatives offering. With the stock now trading below all key moving averages and bearish momentum signals in place, traders should closely monitor $255.82 as a pivotal support level in the near term.






Latest CME Group News



-
 Afghanistan
-
 Albania
-
 Algeria
-
 Angola
-
 Argentina
-
 Armenia
-
 Australia
-
 Austria
-
 Azerbaijan
-
 Bahamas
-
 Bahrain
-
 Bangladesh
-
 Belarus
-
 Belgium
-
 Bolivia
-
 Botswana
-
 Brazil
-
 Brunei
-
 Bulgaria
-
 Cambodia
-
 Cameroon
-
 Canada
-
 Chile
-
 China
-
 Colombia
-
 Congo
-
 Costa Rica
-
 Cote d'Ivoire
-
 Croatia
-
 Cuba
-
 Cyprus
-
 Czechia
-
 DR Congo
-
 Denmark
-
 Dominican Republic
-
 Ecuador
-
 Egypt
-
 El Salvador
-
 Estonia
-
 Eswatini
-
 Ethiopia
-
 Finland
-
 France
-
 Georgia
-
 Germany
-
 Ghana
-
 Greece
-
 Haiti
-
 Hong Kong
-
 Hungary
-
 India
-
 Indonesia
-
 Iran, Islamic republic
-
 Iraq
-
 Ireland
-
 Israel
-
 Italy
-
 Jamaica
-
 Japan
-
 Jordan
-
 Kazakhstan
-
 Kenya
-
 Korea
-
 Kuwait
-
 Kyrgyzstan
-
 Laos
-
 Latvia
-
 Lebanon
-
 Lesotho
-
 Libya
-
 Lithuania
-
 Luxembourg
-
 Madagascar
-
 Malaysia
-
 Malta
-
 Mauritius
-
 Mexico
-
 Moldova
-
 Mongolia
-
 Montenegro
-
 Morocco
-
 Mozambique
-
 Myanmar
-
 Namibia
-
 Nepal
-
 Netherlands
-
 New Zealand
-
 Nigeria
-
 North Macedonia
-
 Norway
-
 Oman
-
 Pakistan
-
 Palestine
-
 Panama
-
 Papua New Guinea
-
 Paraguay
-
 Peru
-
 Philippines
-
 Poland
-
 Portugal
-
 Puerto Rico
-
 Qatar
-
 Reunion
-
 Romania
-
 Rwanda
-
 Saudi Arabia
-
 Serbia
-
 Singapore
-
 Slovakia
-
 Slovenia
-
 Somalia
-
 South Africa
-
 Spain
-
 Sri Lanka
-
 Sweden
-
 Switzerland
-
 Syria
-
 Taiwan
-
 Tajikistan
-
 Tanzania
-
 Thailand
-
 Trinidad and Tobago
-
 Tunisia
-
 Turkey
-
 UAE
-
 Uganda
-
 Ukraine
-
 United Kingdom
-
United States
-
 Uruguay
-
 Uzbekistan
-
 Venezuela
-
 Vietnam
-
 Yemen
-
 Zambia
-
 Zimbabwe
- Forex
- Crypto












