

Can Bit Digital stock avoid deeper losses as near-term volatility stays high?

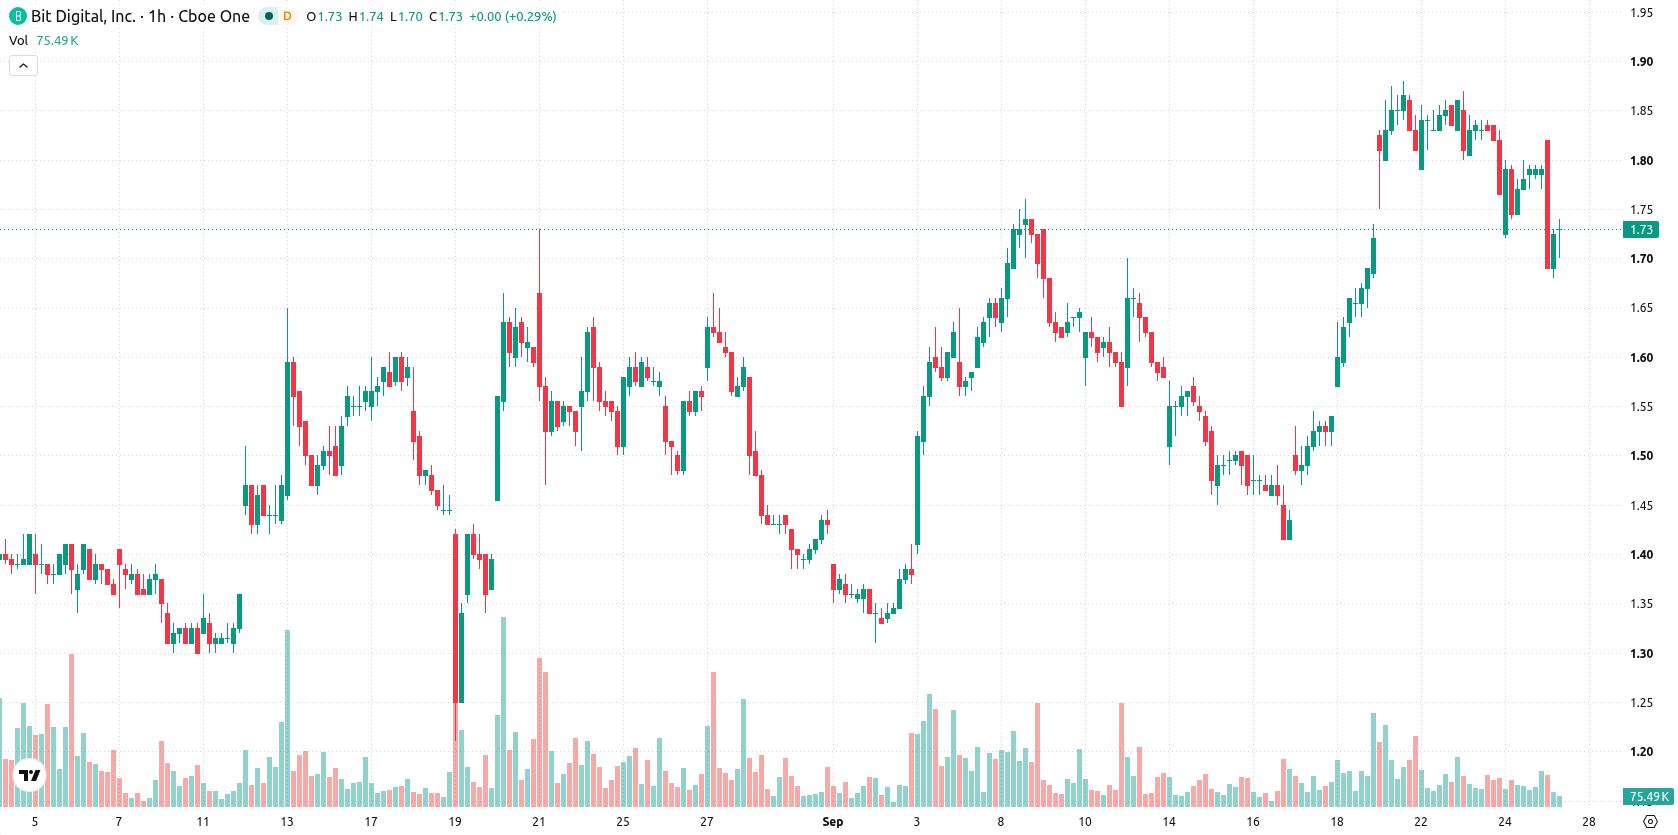
Bit Digital (BTBT) stock is trading at $1.73 after a 3.08% decline for the day, with price action sitting below its key short-term and long-term moving averages but holding just above its medium-term average.
 0.7549
0.8749
Highlights
- BTBT/USD fell 3.08% to $1.73, gapping down $0.07 and ending near the session low amid high volatility.
- The pair trades below its 20-day and 200-day moving averages, indicating short-term and long-term bearish pressure.
- Expected range for the next 2 to 3 days is $1.66 to $1.83, with a slight bias toward further downside movement.
Divergent momentum signals as sellers pressure short-term boundaries
BTBT/USD is trading below the MA-20 and MA-200, while holding just above the MA-50. The Ichimoku Kijun at $1.8 sets immediate resistance. Today's price gapped down by $0.07 and closed near session lows, highlighting pronounced short-term volatility. MACD shows strong buying momentum, contrasted by a weak trend according to ADX. RSI indicates a mild buy signal in a neutral range, whereas Stoch RSI is neutral and CCI points to selling pressure. Bull/Bear Power suggests some intraday buyer advantage, but the Awesome Oscillator is skewed toward sellers.
Downside risk persists amid narrow consolidation range
Over the next two to three sessions, the price is expected to consolidate within a $1.66 to $1.83 volatility band relative to current levels. There is a 52% probability of a further downward move, with 48% chance for a bounce. A clear break above the $1.8 resistance would open the door for bullish momentum, while a drop below $1.66 would confirm continued downside risk.
Earlier, analysts noted that Bit Digital had built notable short-term bullish momentum as technical signals turned more positive. However, the recent shift below key moving averages and the emergence of volatility underscore the importance of monitoring the $1.8 resistance and $1.66 support as pivotal levels for the next directional move.






Latest Bit Digital News



-
 Afghanistan
-
 Albania
-
 Algeria
-
 Angola
-
 Argentina
-
 Armenia
-
 Australia
-
 Austria
-
 Azerbaijan
-
 Bahamas
-
 Bahrain
-
 Bangladesh
-
 Belarus
-
 Belgium
-
 Bolivia
-
 Botswana
-
 Brazil
-
 Brunei
-
 Bulgaria
-
 Cambodia
-
 Cameroon
-
 Canada
-
 Chile
-
 China
-
 Colombia
-
 Congo
-
 Costa Rica
-
 Cote d'Ivoire
-
 Croatia
-
 Cuba
-
 Cyprus
-
 Czechia
-
 DR Congo
-
 Denmark
-
 Dominican Republic
-
 Ecuador
-
 Egypt
-
 El Salvador
-
 Estonia
-
 Eswatini
-
 Ethiopia
-
 Finland
-
 France
-
 Georgia
-
 Germany
-
 Ghana
-
 Greece
-
 Haiti
-
 Hong Kong
-
 Hungary
-
 India
-
 Indonesia
-
 Iran, Islamic republic
-
 Iraq
-
 Ireland
-
 Israel
-
 Italy
-
 Jamaica
-
 Japan
-
 Jordan
-
 Kazakhstan
-
 Kenya
-
 Korea
-
 Kuwait
-
 Kyrgyzstan
-
 Laos
-
 Latvia
-
 Lebanon
-
 Lesotho
-
 Libya
-
 Lithuania
-
 Luxembourg
-
 Madagascar
-
 Malaysia
-
 Malta
-
 Mauritius
-
 Mexico
-
 Moldova
-
 Mongolia
-
 Montenegro
-
 Morocco
-
 Mozambique
-
 Myanmar
-
 Namibia
-
 Nepal
-
 Netherlands
-
 New Zealand
-
 Nigeria
-
 North Macedonia
-
 Norway
-
 Oman
-
 Pakistan
-
 Palestine
-
 Panama
-
 Papua New Guinea
-
 Paraguay
-
 Peru
-
 Philippines
-
 Poland
-
 Portugal
-
 Puerto Rico
-
 Qatar
-
 Reunion
-
 Romania
-
 Rwanda
-
 Saudi Arabia
-
 Serbia
-
 Singapore
-
 Slovakia
-
 Slovenia
-
 Somalia
-
 South Africa
-
 Spain
-
 Sri Lanka
-
 Sweden
-
 Switzerland
-
 Syria
-
 Taiwan
-
 Tajikistan
-
 Tanzania
-
 Thailand
-
 Trinidad and Tobago
-
 Tunisia
-
 Turkey
-
 UAE
-
 Uganda
-
 Ukraine
-
 United Kingdom
-
United States
-
 Uruguay
-
 Uzbekistan
-
 Venezuela
-
 Vietnam
-
 Yemen
-
 Zambia
-
 Zimbabwe
- Forex
- Crypto












