

Enbridge stock holds near C$66.91 resistance as sellers dominate short-term trend

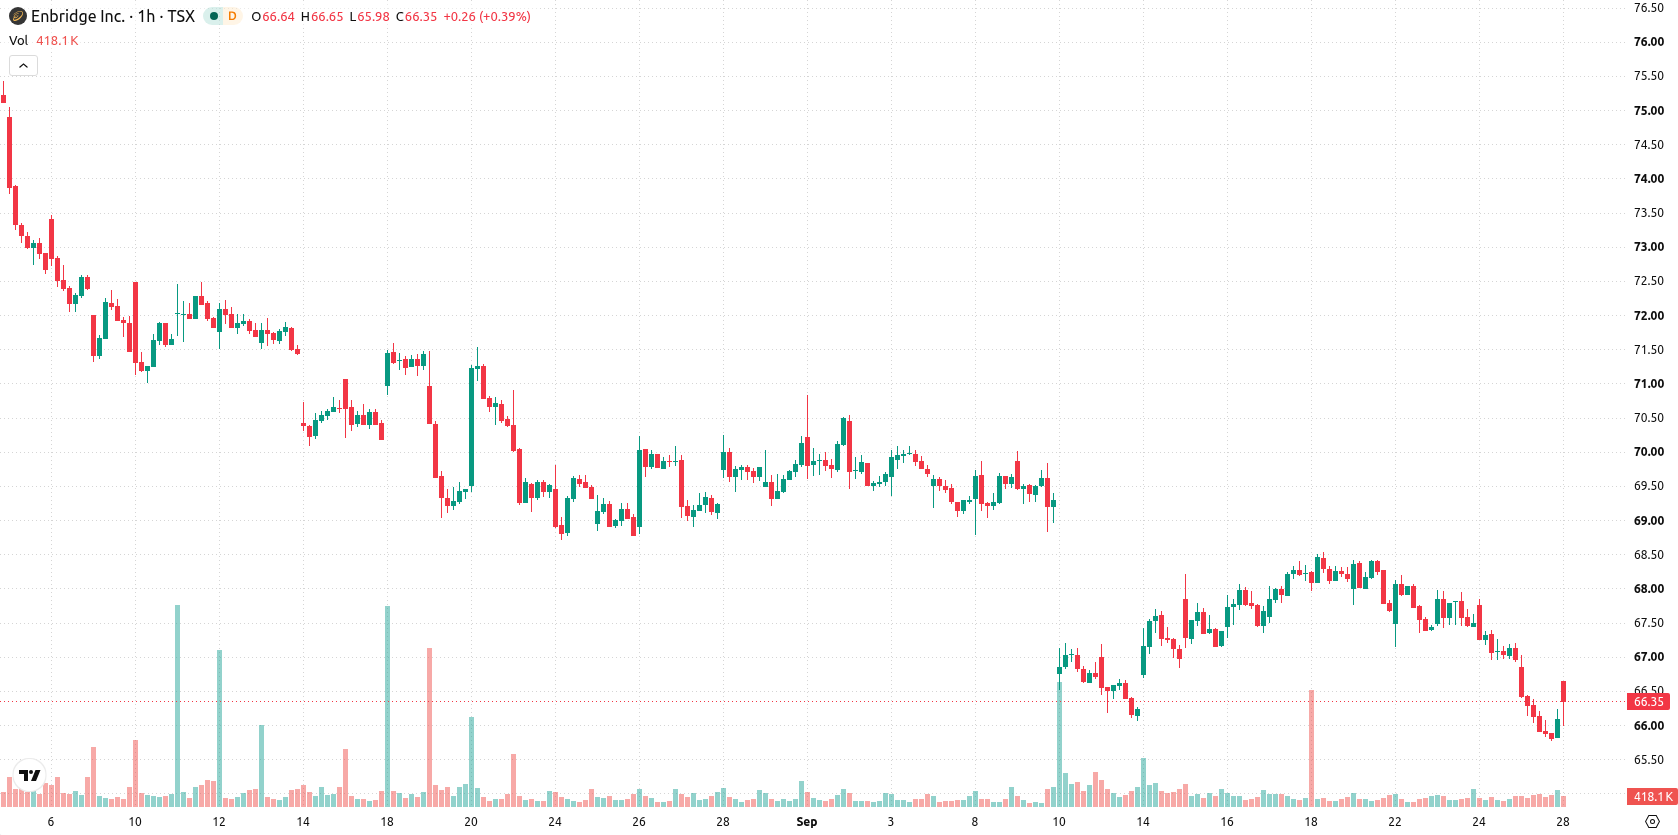
Enbridge (ENB) stock is trading at C$66.4 in today's session, reflecting a slight upward move. The price remains below its key short- and long-term moving averages, underscoring subdued momentum at present.
 68.27
68.97
Highlights
- ENB/CAD trades below short, medium, and long-term moving averages, indicating sustained bearish pressure across all timeframes.
- Momentum signals remain weak with several indicators in oversold territory and seller dominance, despite isolated short-term buy signals.
- Expected trading range for the next several days is C$65.31 to C$67.49, with a 57% probability of further downside.
Mixed momentum signals amid persistent resistance and oversold readings
On the hourly chart, ENB is trading below the MA-20 at C$66.91 and MA-50 at C$67.58. On the daily timeframe, it remains under the long-term MA-200 at C$72.26. The Ichimoku Kijun at C$66.91 marks immediate resistance. MACD and ADX both register sell conditions, and the RSI stands at 32.33, indicating a sell bias. CCI and Bull/Bear Power both reflect oversold conditions and ongoing seller dominance, while the Stoch RSI flashes a strong buy signal and the Awesome Oscillator reads neutral. Overall, intraday strength is limited as momentum signals remain mixed and volatility stays low.
Sideways trajectory likely as resistance and support shape direction
For the next several days, ENB is expected to trade in a range between C$65.31 and C$67.49, representing a typical volatility band relative to current levels. Probability modeling points to a 43% chance of an upside move, with a 57% likelihood of further downside. The base case envisions continued sideways action in this corridor. Should resistance at C$66.91 be broken, a short-term rally may materialize; failure to hold above C$65.31 could open the way for further declines.
Earlier, analysts noted that Enbridge shares were under persistent bearish pressure, with technical factors pointing to ongoing weakness. The current analysis adds nuance by highlighting mixed momentum signals amid limited intraday strength, indicating that a decisive move above C$66.91 or below C$65.31 will be critical for the next directional shift.










-
 Afghanistan
-
 Albania
-
 Algeria
-
 Angola
-
 Argentina
-
 Armenia
-
 Australia
-
 Austria
-
 Azerbaijan
-
 Bahamas
-
 Bahrain
-
 Bangladesh
-
 Belarus
-
 Belgium
-
 Bolivia
-
 Botswana
-
 Brazil
-
 Brunei
-
 Bulgaria
-
 Cambodia
-
 Cameroon
-
 Canada
-
 Chile
-
 China
-
 Colombia
-
 Congo
-
 Costa Rica
-
 Cote d'Ivoire
-
 Croatia
-
 Cuba
-
 Cyprus
-
 Czechia
-
 DR Congo
-
 Denmark
-
 Dominican Republic
-
 Ecuador
-
 Egypt
-
 El Salvador
-
 Estonia
-
 Eswatini
-
 Ethiopia
-
 Finland
-
 France
-
 Georgia
-
 Germany
-
 Ghana
-
 Greece
-
 Haiti
-
 Hong Kong
-
 Hungary
-
 India
-
 Indonesia
-
 Iran, Islamic republic
-
 Iraq
-
 Ireland
-
 Israel
-
 Italy
-
 Jamaica
-
 Japan
-
 Jordan
-
 Kazakhstan
-
 Kenya
-
 Korea
-
 Kuwait
-
 Kyrgyzstan
-
 Laos
-
 Latvia
-
 Lebanon
-
 Lesotho
-
 Libya
-
 Lithuania
-
 Luxembourg
-
 Madagascar
-
 Malaysia
-
 Malta
-
 Mauritius
-
 Mexico
-
 Moldova
-
 Mongolia
-
 Montenegro
-
 Morocco
-
 Mozambique
-
 Myanmar
-
 Namibia
-
 Nepal
-
 Netherlands
-
 New Zealand
-
 Nigeria
-
 North Macedonia
-
 Norway
-
 Oman
-
 Pakistan
-
 Palestine
-
 Panama
-
 Papua New Guinea
-
 Paraguay
-
 Peru
-
 Philippines
-
 Poland
-
 Portugal
-
 Puerto Rico
-
 Qatar
-
 Reunion
-
 Romania
-
 Rwanda
-
 Saudi Arabia
-
 Serbia
-
 Singapore
-
 Slovakia
-
 Slovenia
-
 Somalia
-
 South Africa
-
 Spain
-
 Sri Lanka
-
 Sweden
-
 Switzerland
-
 Syria
-
 Taiwan
-
 Tajikistan
-
 Tanzania
-
 Thailand
-
 Trinidad and Tobago
-
 Tunisia
-
 Turkey
-
 UAE
-
 Uganda
-
 Ukraine
-
 United Kingdom
-
United States
-
 Uruguay
-
 Uzbekistan
-
 Venezuela
-
 Vietnam
-
 Yemen
-
 Zambia
-
 Zimbabwe
- Forex
- Crypto












