

What's behind Intuit's latest 2.3% stock pullback?

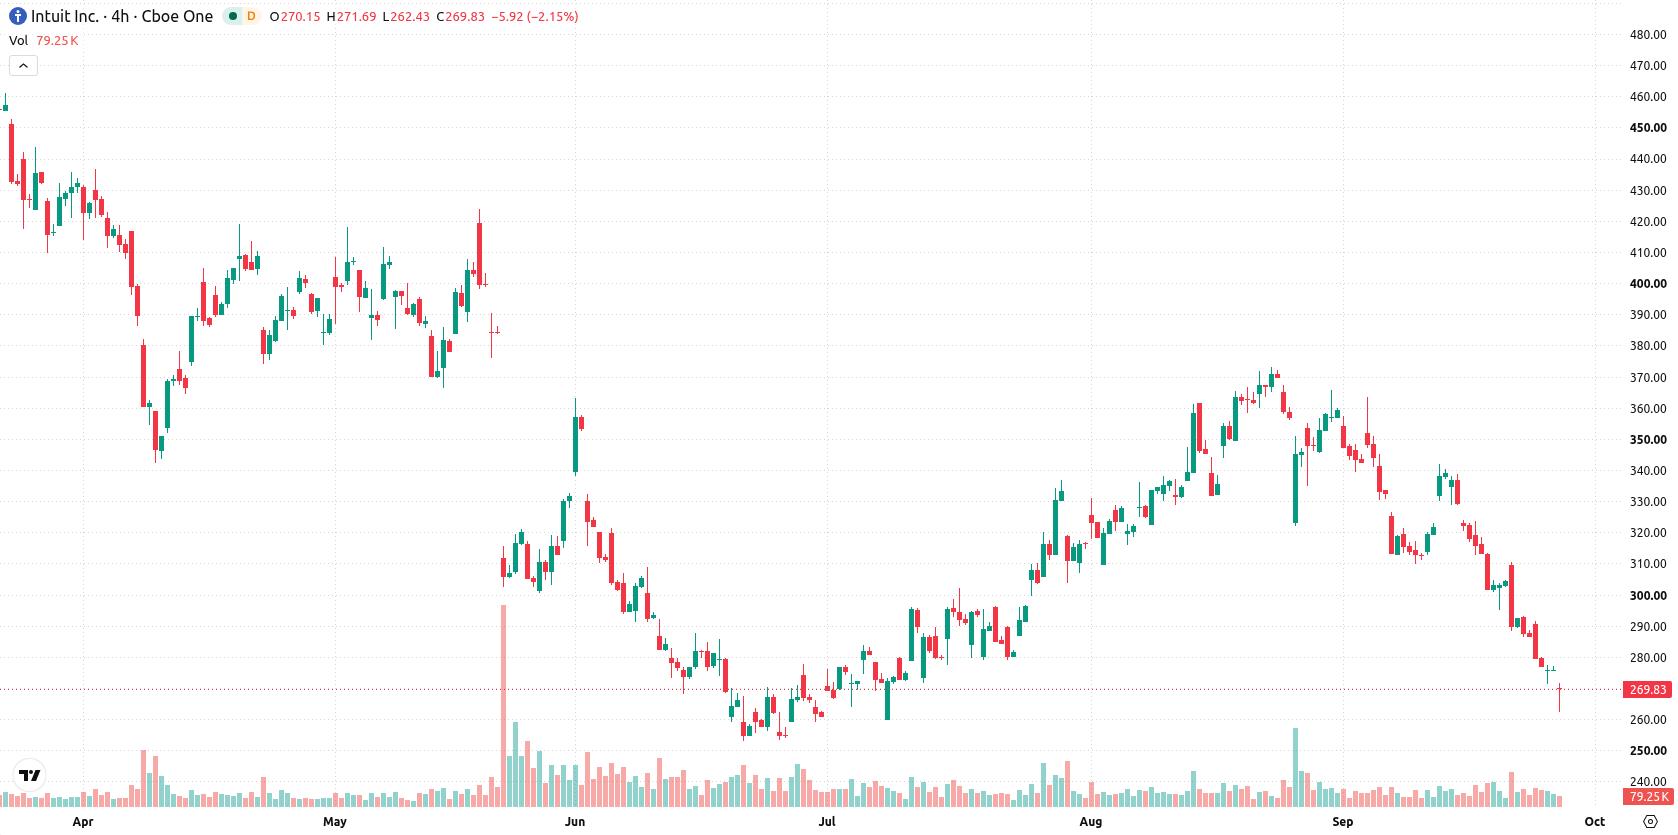
Intuit Inc. (INTU) slid 2.34% after a sharp bout of selling pressure, even as the company delivered fiscal fourth quarter earnings and revenue that surpassed expectations. The decline is reinforced by prolonged technical weakness, with the stock trading below its 20-day, 50-day, and 200-day moving averages.
 340.01
366.19
Highlights
- Intuit reported adjusted earnings per share of $4.03 for the fiscal fourth quarter, beating the $3.58 consensus estimate.
- Quarterly revenue reached $4.35 billion, up 13.7% year over year, and the dividend increased to $1.38 per share.
- Shares of Intuit trade well below key moving averages, with technical indicators all signaling a strong ongoing bearish trend and projected range of $251.73 to $286.78 for the next five days.
Earnings and revenue outpace forecasts amid persistent selling
Intuit Inc. reported adjusted earnings per share of $4.03 for the fiscal fourth quarter ended July 31, 2026, exceeding consensus estimates of $3.58. Quarterly revenue reached $4.35 billion, which was above the projected $4.27 billion and reflected a 13.7% year-over-year increase. The company increased its quarterly dividend from $1.20 to $1.38, though price action has remained under broader selling pressure.
Downtrend confirmed as all-timeframe averages and momentum show bears in control
Intuit is trading below the 20-day, 50-day, and 200-day moving averages at $319.40, $324.62, and $403.40, highlighting persistent downtrend conditions across all observed timeframes. The nearest resistance stands at $273.81, while short-term support is identified at $251.73, confirming a bearish long-term outlook. Downward momentum remains strong, with the MACD and RSI both signaling continued selling. The RSI is deep in oversold territory at 29.63, and additional indicators such as the Stochastic RSI, Commodity Channel Index (CCI), and Bull/Bear Power (BBP) all reflect oversold conditions and dominant seller activity. The Awesome Oscillator (AO) is negative, and intraday action has been weak, with price closing near the day’s low after a modest upside gap at the open. Volatility for the day is measured at 1.27%, and sustained pressure has defined the session.
Earlier, analysts noted that Intuit remained under sustained downside pressure amid persistent technical weakness and heightened competitive challenges. The latest results reinforce this bearish trend, pointing to a prevailing scenario where traders should closely monitor the $251.73 support level for possible further downside in the coming sessions.










-
 Afghanistan
-
 Albania
-
 Algeria
-
 Angola
-
 Argentina
-
 Armenia
-
 Australia
-
 Austria
-
 Azerbaijan
-
 Bahamas
-
 Bahrain
-
 Bangladesh
-
 Belarus
-
 Belgium
-
 Bolivia
-
 Botswana
-
 Brazil
-
 Brunei
-
 Bulgaria
-
 Cambodia
-
 Cameroon
-
 Canada
-
 Chile
-
 China
-
 Colombia
-
 Congo
-
 Costa Rica
-
 Cote d'Ivoire
-
 Croatia
-
 Cuba
-
 Cyprus
-
 Czechia
-
 DR Congo
-
 Denmark
-
 Dominican Republic
-
 Ecuador
-
 Egypt
-
 El Salvador
-
 Estonia
-
 Eswatini
-
 Ethiopia
-
 Finland
-
 France
-
 Georgia
-
 Germany
-
 Ghana
-
 Greece
-
 Haiti
-
 Hong Kong
-
 Hungary
-
 India
-
 Indonesia
-
 Iran, Islamic republic
-
 Iraq
-
 Ireland
-
 Israel
-
 Italy
-
 Jamaica
-
 Japan
-
 Jordan
-
 Kazakhstan
-
 Kenya
-
 Korea
-
 Kuwait
-
 Kyrgyzstan
-
 Laos
-
 Latvia
-
 Lebanon
-
 Lesotho
-
 Libya
-
 Lithuania
-
 Luxembourg
-
 Madagascar
-
 Malaysia
-
 Malta
-
 Mauritius
-
 Mexico
-
 Moldova
-
 Mongolia
-
 Montenegro
-
 Morocco
-
 Mozambique
-
 Myanmar
-
 Namibia
-
 Nepal
-
 Netherlands
-
 New Zealand
-
 Nigeria
-
 North Macedonia
-
 Norway
-
 Oman
-
 Pakistan
-
 Palestine
-
 Panama
-
 Papua New Guinea
-
 Paraguay
-
 Peru
-
 Philippines
-
 Poland
-
 Portugal
-
 Puerto Rico
-
 Qatar
-
 Reunion
-
 Romania
-
 Rwanda
-
 Saudi Arabia
-
 Serbia
-
 Singapore
-
 Slovakia
-
 Slovenia
-
 Somalia
-
 South Africa
-
 Spain
-
 Sri Lanka
-
 Sweden
-
 Switzerland
-
 Syria
-
 Taiwan
-
 Tajikistan
-
 Tanzania
-
 Thailand
-
 Trinidad and Tobago
-
 Tunisia
-
 Turkey
-
 UAE
-
 Uganda
-
 Ukraine
-
 United Kingdom
-
United States
-
 Uruguay
-
 Uzbekistan
-
 Venezuela
-
 Vietnam
-
 Yemen
-
 Zambia
-
 Zimbabwe
- Forex
- Crypto












