

Will Intuit stock hold $267.61 support as restructuring charge drives selloff?

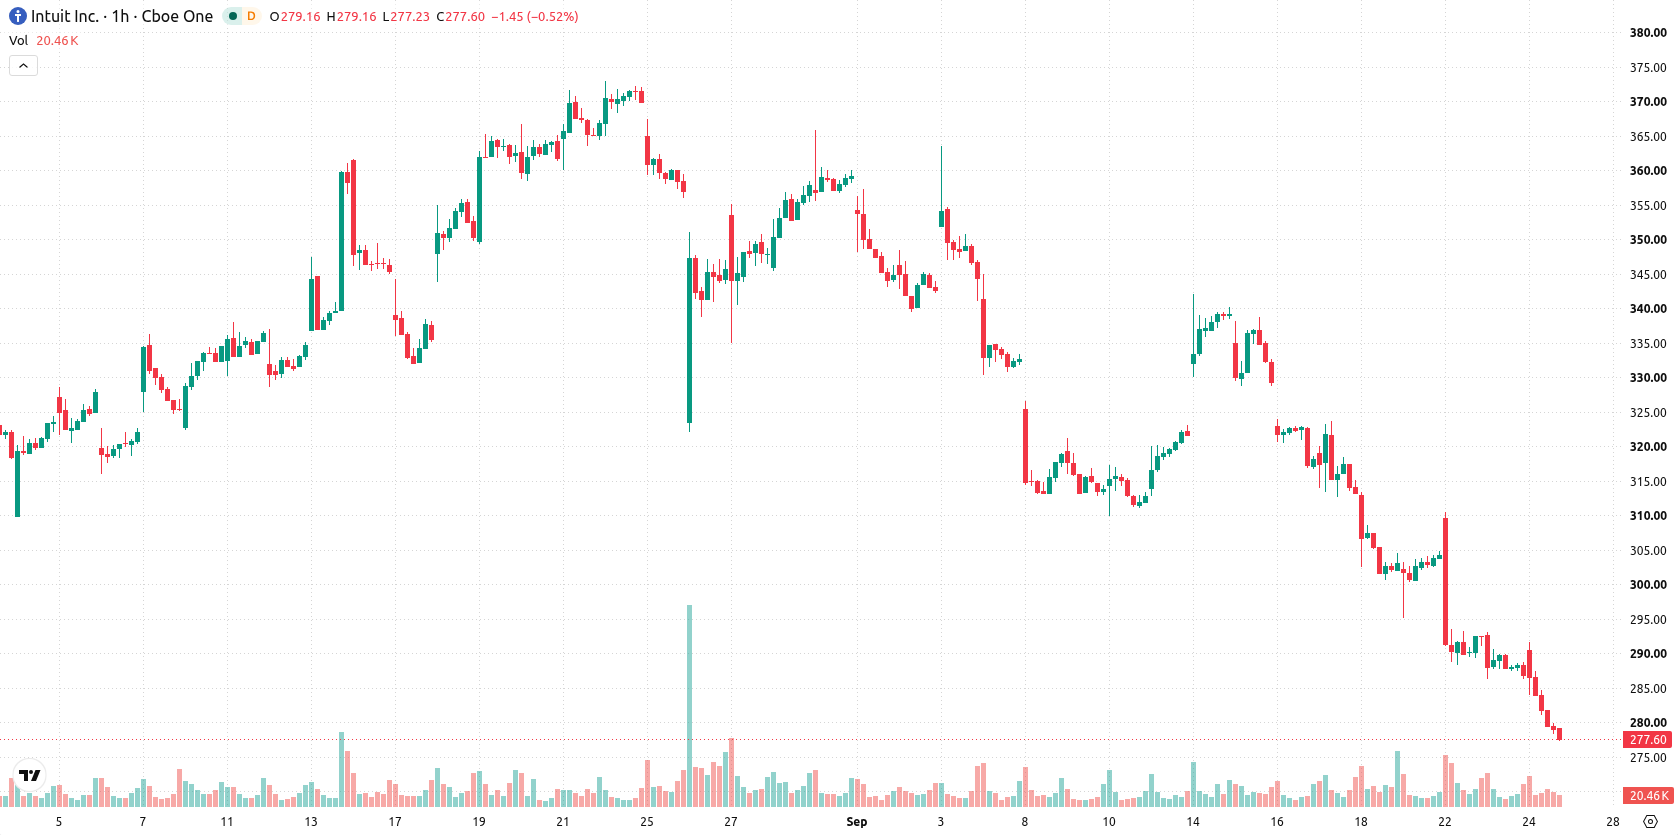
Intuit (INTU) stock is trading at $277.68 after a daily slide of 3.18%. The price sits below its key moving averages, reflecting ongoing momentum pressure.
 300.28
351.45
Highlights
- Intuit cut 17% of its workforce and recorded a $293 million restructuring charge in Q4 2026 to reduce expenses.
- The company repositioned its product lineup to concentrate on AI-powered solutions for improved efficiency and competitiveness.
- Shares of Intuit fell 3.18% today, trading below key moving averages with strong bearish momentum and an expected range of $267.61 to $287.75 in the next several days.
Expense cuts and AI pivot as management responds to headwinds
Intuit has undertaken significant cost reduction measures, including a 17% workforce reduction and a $293 million restructuring charge recorded in Q4 2026, according to Investing.com. These actions reduce operating expenses and reflect management's response to headwinds in financial performance. The company has also repositioned its product portfolio to focus on AI-driven offerings, targeting greater operational efficiency and long-term competitiveness.
Downside risk persists as oversold readings and resistance align
On the hourly chart, INTU is trading below both its MA-20 at $292.6 and MA-50 at $306.98 thresholds, while remaining well below the MA-200 on the daily chart at $407.29. The immediate resistance is defined by the Ichimoku Kijun level at $294.37. Momentum indicators such as MACD and ADX continue to point to downside risk. RSI is at 21.02, while Stochastic RSI, CCI, and Bull/Bear Power all confirm oversold conditions and sustained seller dominance on the intraday timeframes. The Awesome Oscillator remains neutral, providing no additional support or divergence.
Further declines favored as upward breakout odds remain low
Over the next 2 to 3 trading days, INTU is expected to consolidate within a typical volatility band between $267.61 and $287.75. The likelihood of upward movement is very low, with further downside remaining the higher-probability scenario unless a breakout above $294.37 occurs to signal a potential recovery. If price drops below $267.61, risk of additional declines increases substantially.
Earlier, analysts noted that Intuit was under persistent downside pressure as competitive threats and slowing growth weighed on technical and fundamental outlooks. The latest intraday data reinforces this view, with key momentum signals and oversold conditions suggesting traders should closely monitor the $267.61 support level for signs of further weakness or a potential breakdown.











-
 Afghanistan
-
 Albania
-
 Algeria
-
 Angola
-
 Argentina
-
 Armenia
-
 Australia
-
 Austria
-
 Azerbaijan
-
 Bahamas
-
 Bahrain
-
 Bangladesh
-
 Belarus
-
 Belgium
-
 Bolivia
-
 Botswana
-
 Brazil
-
 Brunei
-
 Bulgaria
-
 Cambodia
-
 Cameroon
-
 Canada
-
 Chile
-
 China
-
 Colombia
-
 Congo
-
 Costa Rica
-
 Cote d'Ivoire
-
 Croatia
-
 Cuba
-
 Cyprus
-
 Czechia
-
 DR Congo
-
 Denmark
-
 Dominican Republic
-
 Ecuador
-
 Egypt
-
 El Salvador
-
 Estonia
-
 Eswatini
-
 Ethiopia
-
 Finland
-
 France
-
 Georgia
-
 Germany
-
 Ghana
-
 Greece
-
 Haiti
-
 Hong Kong
-
 Hungary
-
 India
-
 Indonesia
-
 Iran, Islamic republic
-
 Iraq
-
 Ireland
-
 Israel
-
 Italy
-
 Jamaica
-
 Japan
-
 Jordan
-
 Kazakhstan
-
 Kenya
-
 Korea
-
 Kuwait
-
 Kyrgyzstan
-
 Laos
-
 Latvia
-
 Lebanon
-
 Lesotho
-
 Libya
-
 Lithuania
-
 Luxembourg
-
 Madagascar
-
 Malaysia
-
 Malta
-
 Mauritius
-
 Mexico
-
 Moldova
-
 Mongolia
-
 Montenegro
-
 Morocco
-
 Mozambique
-
 Myanmar
-
 Namibia
-
 Nepal
-
 Netherlands
-
 New Zealand
-
 Nigeria
-
 North Macedonia
-
 Norway
-
 Oman
-
 Pakistan
-
 Palestine
-
 Panama
-
 Papua New Guinea
-
 Paraguay
-
 Peru
-
 Philippines
-
 Poland
-
 Portugal
-
 Puerto Rico
-
 Qatar
-
 Reunion
-
 Romania
-
 Rwanda
-
 Saudi Arabia
-
 Serbia
-
 Singapore
-
 Slovakia
-
 Slovenia
-
 Somalia
-
 South Africa
-
 Spain
-
 Sri Lanka
-
 Sweden
-
 Switzerland
-
 Syria
-
 Taiwan
-
 Tajikistan
-
 Tanzania
-
 Thailand
-
 Trinidad and Tobago
-
 Tunisia
-
 Turkey
-
 UAE
-
 Uganda
-
 Ukraine
-
 United Kingdom
-
United States
-
 Uruguay
-
 Uzbekistan
-
 Venezuela
-
 Vietnam
-
 Yemen
-
 Zambia
-
 Zimbabwe
- Forex
- Crypto












