

INTU slides over 2% as selling pressure remains amid competition from AI-native rivals

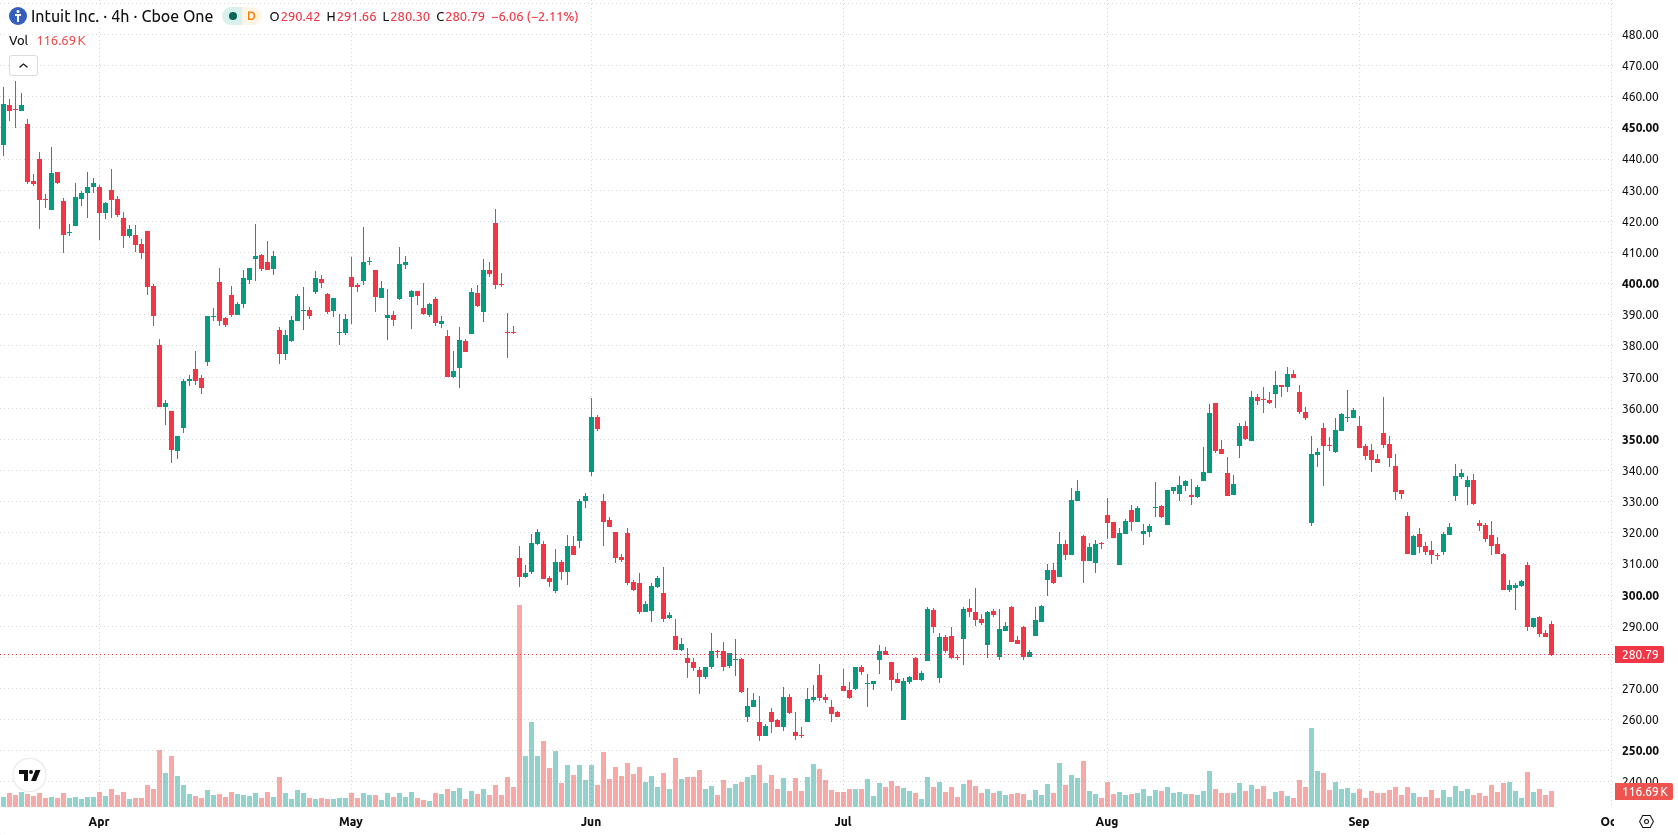
Intuit Inc. (INTU) fell 2.23% as the market responded to continued investor concerns about the rise of autonomous AI competitors disrupting its core tax and bookkeeping business. The scale of the decline is reinforced by the stock’s position below all key moving averages, which confirms ongoing selling pressure and a bearish outlook across timeframes.
 343.92
Highlights
- Intuit reported fiscal 2026 revenue of $21.448 billion, up 14%, and raised its quarterly dividend by 15% to $1.38.
- The company reduced its workforce by 17%, took a $293 million restructuring charge, and projected slower 9 to 10% revenue growth for fiscal 2027 due to higher customer attrition in TurboTax and increased competition from AI-native firms.
- Shares of Intuit remain under sustained selling pressure, trading below key moving averages, with technical signals indicating a bearish trend and an expected range of $269.16 to $291.67 over the next five trading days.
Revenue gains tempered by slower outlook amid restructuring and AI rivalry
Intuit reported a 14% increase in revenue to $21.448 billion for fiscal 2026 and achieved a fifth consecutive EPS beat. The company implemented a 17% workforce reduction, recorded a $293 million restructuring charge, and raised its quarterly dividend by 15% to $1.38. Guidance for fiscal 2027 forecast slower revenue growth of 9–10% due to increased customer attrition from higher pricing and stronger competition from AI-native rivals, especially in the TurboTax segment, though price action has remained under broader selling pressure.
Persistent downside momentum as oversold indicators meet bearish alignment
Intuit remains below the 20-day ($326.44), 50-day ($325.05), and 200-day ($407.29) moving averages, reflecting sustained selling pressure across all timeframes and confirming a bearish alignment in the longer term. The nearest ceiling is at $281.16, while immediate support is at $269.16, with distant overhead levels reinforcing the prevailing downtrend. Momentum signals are predominantly negative as the Moving Average Convergence Divergence (MACD) and Average Directional Index (ADX) both forecast weakness, with the ADX value of 14.33 suggesting an absence of strong trend direction. The Relative Strength Index (RSI) at 32.86, Stochastic RSI at 0, and Commodity Channel Index (CCI) at -146.62 all signal oversold conditions. Bull/Bear Power (BBP) at -22.54 shows clear dominance by sellers and an oversold forecast. The Awesome Oscillator (AO) is also negative, aligning with the dominant downward momentum. Intraday volatility stands at 2.13%. The overall intraday tone remains pressured, with the price reacting weakly after the open and momentum indicators supporting further selling.
Earlier, analysts noted that Intuit remained under sustained technical pressure amid weaker growth expectations and persistent downside risks. This latest analysis strengthens that outlook with updated momentum and volatility data, highlighting $269.16 as the critical support level to monitor for potential further downside in the near term.










-
 Afghanistan
-
 Albania
-
 Algeria
-
 Angola
-
 Argentina
-
 Armenia
-
 Australia
-
 Austria
-
 Azerbaijan
-
 Bahamas
-
 Bahrain
-
 Bangladesh
-
 Belarus
-
 Belgium
-
 Bolivia
-
 Botswana
-
 Brazil
-
 Brunei
-
 Bulgaria
-
 Cambodia
-
 Cameroon
-
 Canada
-
 Chile
-
 China
-
 Colombia
-
 Congo
-
 Costa Rica
-
 Cote d'Ivoire
-
 Croatia
-
 Cuba
-
 Cyprus
-
 Czechia
-
 DR Congo
-
 Denmark
-
 Dominican Republic
-
 Ecuador
-
 Egypt
-
 El Salvador
-
 Estonia
-
 Eswatini
-
 Ethiopia
-
 Finland
-
 France
-
 Georgia
-
 Germany
-
 Ghana
-
 Greece
-
 Haiti
-
 Hong Kong
-
 Hungary
-
 India
-
 Indonesia
-
 Iran, Islamic republic
-
 Iraq
-
 Ireland
-
 Israel
-
 Italy
-
 Jamaica
-
 Japan
-
 Jordan
-
 Kazakhstan
-
 Kenya
-
 Korea
-
 Kuwait
-
 Kyrgyzstan
-
 Laos
-
 Latvia
-
 Lebanon
-
 Lesotho
-
 Libya
-
 Lithuania
-
 Luxembourg
-
 Madagascar
-
 Malaysia
-
 Malta
-
 Mauritius
-
 Mexico
-
 Moldova
-
 Mongolia
-
 Montenegro
-
 Morocco
-
 Mozambique
-
 Myanmar
-
 Namibia
-
 Nepal
-
 Netherlands
-
 New Zealand
-
 Nigeria
-
 North Macedonia
-
 Norway
-
 Oman
-
 Pakistan
-
 Palestine
-
 Panama
-
 Papua New Guinea
-
 Paraguay
-
 Peru
-
 Philippines
-
 Poland
-
 Portugal
-
 Puerto Rico
-
 Qatar
-
 Reunion
-
 Romania
-
 Rwanda
-
 Saudi Arabia
-
 Serbia
-
 Singapore
-
 Slovakia
-
 Slovenia
-
 Somalia
-
 South Africa
-
 Spain
-
 Sri Lanka
-
 Sweden
-
 Switzerland
-
 Syria
-
 Taiwan
-
 Tajikistan
-
 Tanzania
-
 Thailand
-
 Trinidad and Tobago
-
 Tunisia
-
 Turkey
-
 UAE
-
 Uganda
-
 Ukraine
-
 United Kingdom
-
United States
-
 Uruguay
-
 Uzbekistan
-
 Venezuela
-
 Vietnam
-
 Yemen
-
 Zambia
-
 Zimbabwe
- Forex
- Crypto












