

Intuit set to report Q1 FY27 earnings: Can INTU avoid further declines?

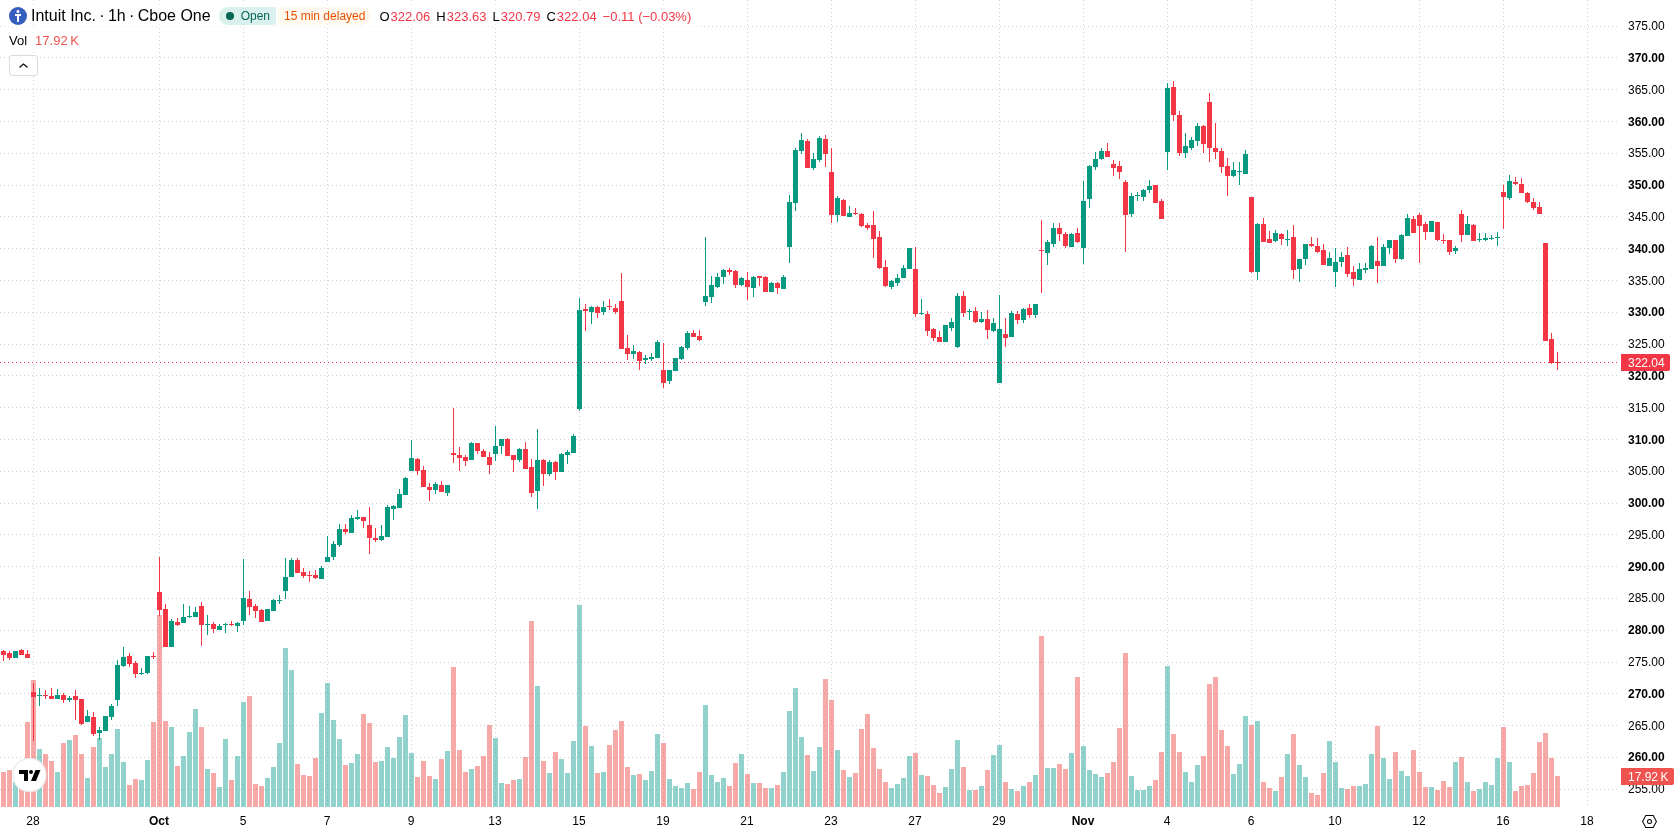
Intuit Inc. (INTU) stock is trading at $322.86, down 6.54% on the day and hovering near session lows as of the latest session. The price is positioned below its key moving averages, signaling ongoing weakness relative to both short- and longer-term trends.
 332.03
351.38
Highlights
- Intuit projects fiscal 2027 revenue in the range of $23.28 billion to $23.51 billion, representing 9% to 10% growth.
- Shares face event risk and uncertainty as investors await profit figures, resulting in subdued demand and a reserved trading response.
- Shares of Intuit trade below key moving averages and momentum indicators show sustained selling pressure with a projected range of $315.32 to $330.4.
Event risk and muted sentiment ahead of quarterly earnings release
Intuit is set to report its first-quarter fiscal 2027 results on November 19, 2026, maintaining the spotlight on its previously guided revenue growth range of 9% to 10%, or $23.28 billion to $23.51 billion, according to Fool. The upcoming earnings release introduces event risk and fuels uncertainty around near-term revenue quality, which can lead to cautious trading and subdued demand ahead of key profit figures. This heightened anticipation has contributed to a more reserved market response amid broader risk-off sentiment.
Bearish momentum and oversold levels reinforce downside risks
On the technical front, INTU is trading below the H1 SMA-20 at $343.39, below the H1 SMA-50 at $341.4, and under the D1 SMA-200 at $349.96. The Ichimoku Kijun at $340.14 serves as immediate resistance. MACD and the Awesome Oscillator are neutral, while ADX signals a selling bias. RSI, Stoch RSI, and CCI are all deep into oversold territory, suggesting a potential for near-term rebound but not yet an established reversal signal. Bull/Bear Power stands at -2.69, indicating pronounced seller dominance. These indicators reflect underlying bearish momentum and persistent downside pressure despite extreme oscillator readings.
Downside favored as volatility range limits reversal prospects
In the short term, INTU is expected to trade within a price range of $315.32 to $330.4, representing a typical volatility band relative to current levels. The probability for a move upward stands at 25%, while the likelihood of further downside is 75%, making a swift reversal less probable. Consolidation within this corridor appears to be the most likely scenario if current momentum persists. However, a sustained push above immediate resistance could trigger a sharp upward move, while loss of the lower range boundary may accelerate additional selling.
Earlier, analysts noted that Intuit’s technical setup was marked by price stability and mixed momentum signals, with traders closely monitoring the earnings event and related resistance levels. The current breakdown below moving averages and deep oscillator oversold readings signals intensifying downside risk, making the $315.32–$330.4 trading corridor critical to watch for potential shifts in either direction following the earnings release.











-
 Afghanistan
-
 Albania
-
 Algeria
-
 Angola
-
 Argentina
-
 Armenia
-
 Australia
-
 Austria
-
 Azerbaijan
-
 Bahamas
-
 Bahrain
-
 Bangladesh
-
 Belarus
-
 Belgium
-
 Bolivia
-
 Botswana
-
 Brazil
-
 Brunei
-
 Bulgaria
-
 Cambodia
-
 Cameroon
-
 Canada
-
 Chile
-
 China
-
 Colombia
-
 Congo
-
 Costa Rica
-
 Cote d'Ivoire
-
 Croatia
-
 Cuba
-
 Cyprus
-
 Czechia
-
 DR Congo
-
 Denmark
-
 Dominican Republic
-
 Ecuador
-
 Egypt
-
 El Salvador
-
 Estonia
-
 Eswatini
-
 Ethiopia
-
 Finland
-
 France
-
 Georgia
-
 Germany
-
 Ghana
-
 Greece
-
 Haiti
-
 Hong Kong
-
 Hungary
-
 India
-
 Indonesia
-
 Iran, Islamic republic
-
 Iraq
-
 Ireland
-
 Israel
-
 Italy
-
 Jamaica
-
 Japan
-
 Jordan
-
 Kazakhstan
-
 Kenya
-
 Korea
-
 Kuwait
-
 Kyrgyzstan
-
 Laos
-
 Latvia
-
 Lebanon
-
 Lesotho
-
 Libya
-
 Lithuania
-
 Luxembourg
-
 Madagascar
-
 Malaysia
-
 Malta
-
 Mauritius
-
 Mexico
-
 Moldova
-
 Mongolia
-
 Montenegro
-
 Morocco
-
 Mozambique
-
 Myanmar
-
 Namibia
-
 Nepal
-
 Netherlands
-
 New Zealand
-
 Nigeria
-
 North Macedonia
-
 Norway
-
 Oman
-
 Pakistan
-
 Palestine
-
 Panama
-
 Papua New Guinea
-
 Paraguay
-
 Peru
-
 Philippines
-
 Poland
-
 Portugal
-
 Puerto Rico
-
 Qatar
-
 Reunion
-
 Romania
-
 Rwanda
-
 Saudi Arabia
-
 Serbia
-
 Singapore
-
 Slovakia
-
 Slovenia
-
 Somalia
-
 South Africa
-
 Spain
-
 Sri Lanka
-
 Sweden
-
 Switzerland
-
 Syria
-
 Taiwan
-
 Tajikistan
-
 Tanzania
-
 Thailand
-
 Trinidad and Tobago
-
 Tunisia
-
 Turkey
-
 UAE
-
 Uganda
-
 Ukraine
-
 United Kingdom
-
United States
-
 Uruguay
-
 Uzbekistan
-
 Venezuela
-
 Vietnam
-
 Yemen
-
 Zambia
-
 Zimbabwe
- Forex
- Crypto












