

Intuit shares technical analysis: Downward price move dominates as session low nears

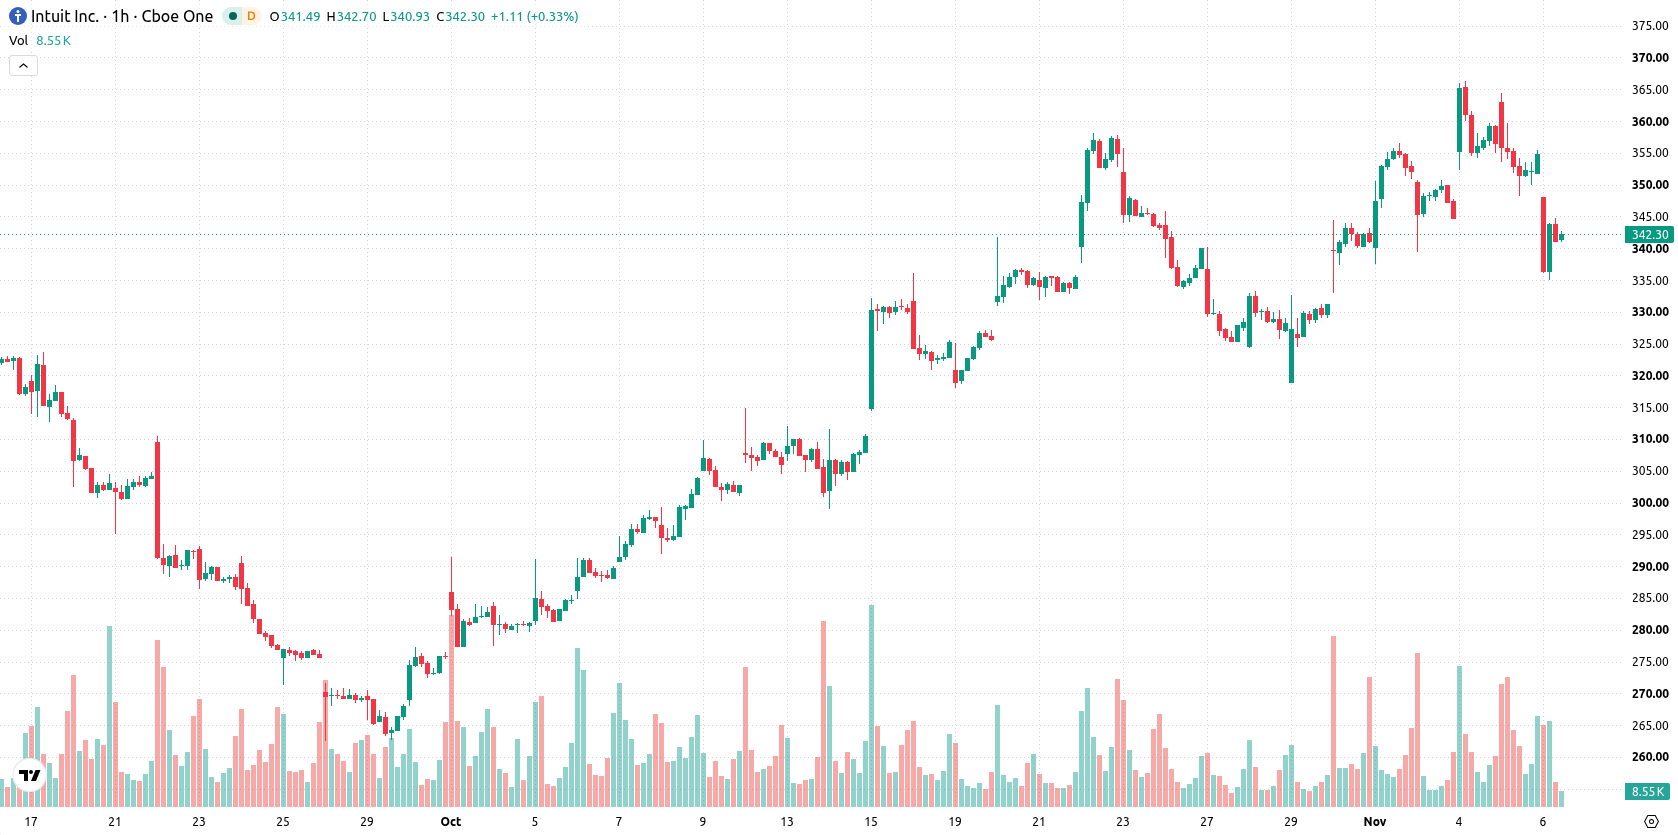
Intuit Inc. (INTU) stock is trading at $341.05, down 3.89% for the session and near its daily low. The price currently sits below its key moving averages, underscoring continued short-term and long-term downside pressure.
 344.62
366.19
Highlights
- Intuit has introduced AI-powered automation features aimed at improving accounting workflows for businesses and accountants across several industries.
- The expansion of Intuit Intelligence is intended to increase workflow efficiency and strengthen long-term platform adoption and competitive positioning.
- Shares of Intuit trade below short- and long-term moving averages under persistent bearish pressure, with the next sessions expected between $331.27 to $350.83.
AI feature rollout boosts platform scope amid selling trend
Intuit has introduced new AI-powered features across its platform, as reported by Yahoo Finance, with a focus on automating accounting workflows for businesses and accountants in several industries. This strategic update broadens the application of Intuit Intelligence technologies and enhances workflow efficiency for its professional user base. While these enhancements are likely to strengthen long-term adoption and competitive positioning, price action has remained under broader selling pressure.
Mixed momentum signals with strong resistance and volatility gap
INTU trades below its MA-20 and MA-50 on the H1 timeframe and remains under its long-term MA-200. The Ichimoku Kijun level at $352.84 currently acts as immediate resistance for the price. Momentum signals show a split: MACD presents strong buy dynamics, while ADX is neutral. RSI, Stoch RSI, and CCI also remain neutral, and Bull/Bear Power stands positive at 1.38, providing a slight advantage for buyers over sellers during intraday sessions. Nevertheless, this technical backdrop is contrasted by the price opening with a $7.77 gap and experiencing high volatility intraday, now trading near the session low.
Range-bound outlook with slight bullish edge if resistance breaks
In the short term, the price is expected to move within the $331.27 to $350.83 range, reflecting the typical volatility band relative to current levels. The likelihood of an upward breakout is slightly higher at 53%, while a downward move stands at 47%. If price can push above immediate resistance, a bullish scenario could unfold, whereas a drop below support would suggest further downside risk.
Earlier, analysts noted that despite Intuit's continued investment in AI-driven automation and expanding institutional interest, the stock remained under pressure from persistent selling and elevated volatility. The current analysis builds on this view by highlighting that the next decisive move hinges on whether price can break above or below its immediate $352.84 resistance and $331.27 support, offering traders clear levels to watch for a shift in trend.










-
 Afghanistan
-
 Albania
-
 Algeria
-
 Angola
-
 Argentina
-
 Armenia
-
 Australia
-
 Austria
-
 Azerbaijan
-
 Bahamas
-
 Bahrain
-
 Bangladesh
-
 Belarus
-
 Belgium
-
 Bolivia
-
 Botswana
-
 Brazil
-
 Brunei
-
 Bulgaria
-
 Cambodia
-
 Cameroon
-
 Canada
-
 Chile
-
 China
-
 Colombia
-
 Congo
-
 Costa Rica
-
 Cote d'Ivoire
-
 Croatia
-
 Cuba
-
 Cyprus
-
 Czechia
-
 DR Congo
-
 Denmark
-
 Dominican Republic
-
 Ecuador
-
 Egypt
-
 El Salvador
-
 Estonia
-
 Eswatini
-
 Ethiopia
-
 Finland
-
 France
-
 Georgia
-
 Germany
-
 Ghana
-
 Greece
-
 Haiti
-
 Hong Kong
-
 Hungary
-
 India
-
 Indonesia
-
 Iran, Islamic republic
-
 Iraq
-
 Ireland
-
 Israel
-
 Italy
-
 Jamaica
-
 Japan
-
 Jordan
-
 Kazakhstan
-
 Kenya
-
 Korea
-
 Kuwait
-
 Kyrgyzstan
-
 Laos
-
 Latvia
-
 Lebanon
-
 Lesotho
-
 Libya
-
 Lithuania
-
 Luxembourg
-
 Madagascar
-
 Malaysia
-
 Malta
-
 Mauritius
-
 Mexico
-
 Moldova
-
 Mongolia
-
 Montenegro
-
 Morocco
-
 Mozambique
-
 Myanmar
-
 Namibia
-
 Nepal
-
 Netherlands
-
 New Zealand
-
 Nigeria
-
 North Macedonia
-
 Norway
-
 Oman
-
 Pakistan
-
 Palestine
-
 Panama
-
 Papua New Guinea
-
 Paraguay
-
 Peru
-
 Philippines
-
 Poland
-
 Portugal
-
 Puerto Rico
-
 Qatar
-
 Reunion
-
 Romania
-
 Rwanda
-
 Saudi Arabia
-
 Serbia
-
 Singapore
-
 Slovakia
-
 Slovenia
-
 Somalia
-
 South Africa
-
 Spain
-
 Sri Lanka
-
 Sweden
-
 Switzerland
-
 Syria
-
 Taiwan
-
 Tajikistan
-
 Tanzania
-
 Thailand
-
 Trinidad and Tobago
-
 Tunisia
-
 Turkey
-
 UAE
-
 Uganda
-
 Ukraine
-
 United Kingdom
-
United States
-
 Uruguay
-
 Uzbekistan
-
 Venezuela
-
 Vietnam
-
 Yemen
-
 Zambia
-
 Zimbabwe
- Forex
- Crypto












