

INTU slides over 4% as technical resistance and overbought conditions weigh on momentum

Intuit Inc. (INTU) fell 4.34% as selling pressure intensified following its recent acquisition activity and sustained expansion of AI-driven features. The downside move contrasts with generally bullish momentum signals, with current price action limited by overhead resistance and the stock remaining below its long-term moving average.
 348.54
366.19
Highlights
- Intuit expanded its AI product suite with the Sequence acquisition, enabling automation of over 400 million monthly transactions across platforms.
- AI adoption in Intuits ecosystem includes more than 250,000 accounting firms, with institutional investors such as AIA Group Ltd and Rakuten Investment Management Inc. increasing their stakes.
- Shares of Intuit fell 4.34% to $339.45, with technicals showing mixed momentum and a 5-day price expectation of $328.51 to $353.04.
AI expansion and acquisitions drive adoption as institutional flows rise
Intuit has been expanding its AI-driven offerings across product platforms, recently acquiring Sequence to boost automation in accounting workflows. Its AI now categorizes over 400 million transactions each month, with adoption by more than 250,000 accounting firms. Institutional investor activity has shown increased holdings by AIA Group Ltd and Rakuten Investment Management Inc., though price action has remained under broader selling pressure.
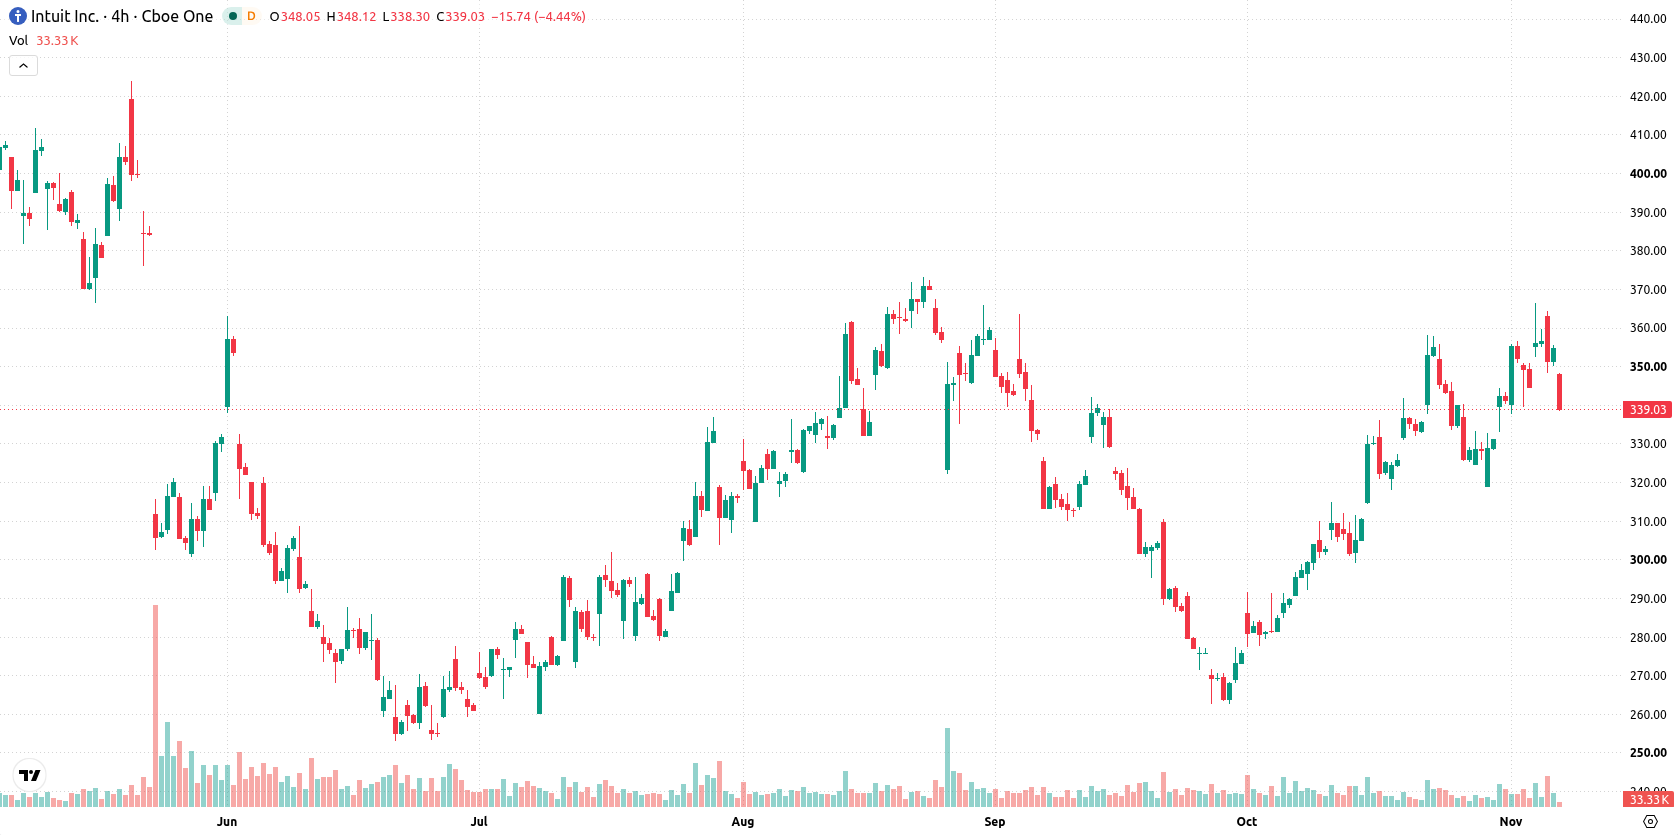
Overbought signals cap upside as bullish momentum faces heavy selling
Intuit is currently trading above its 20-day and 50-day moving averages ($332.21 and $318.64), but remains below the 200-day average at $356.79, reflecting short- and medium-term strength amid a longer-term downtrend. The nearest resistance level stands at $344.6, with near-term support at $332.21. Additional support is signaled by the Ichimoku Kijun at $321.87. Momentum indicators are mixed: MACD and ADX highlight buyer-driven momentum, and the Awesome Oscillator supports this view. The RSI remains neutral, as does the Stochastic RSI, while the Commodity Channel Index (CCI) is in the overbought zone, introducing the potential for a short-term correction. Bull/Bear Power reflects ongoing buyer dominance in intraday action. Price recently traded near the session low, and daily volatility reached 4.63%, suggesting heavy selling pressure after the open. This negative daily move is at odds with generally bullish momentum readings, with the overbought CCI highlighting that near-term upside could be capped.
Earlier, analysts noted that Intuit's strong AI-driven expansion and automation-focused acquisitions positioned the company for continued momentum, with technical signals emphasizing the need to monitor for possible pullbacks. The current analysis adds that despite ongoing development in AI adoption and institutional investment, recent intensified selling has heightened volatility, making the $344.6 resistance and $332.21 support critical levels to watch for confirming near-term direction.










-
 Afghanistan
-
 Albania
-
 Algeria
-
 Angola
-
 Argentina
-
 Armenia
-
 Australia
-
 Austria
-
 Azerbaijan
-
 Bahamas
-
 Bahrain
-
 Bangladesh
-
 Belarus
-
 Belgium
-
 Bolivia
-
 Botswana
-
 Brazil
-
 Brunei
-
 Bulgaria
-
 Cambodia
-
 Cameroon
-
 Canada
-
 Chile
-
 China
-
 Colombia
-
 Congo
-
 Costa Rica
-
 Cote d'Ivoire
-
 Croatia
-
 Cuba
-
 Cyprus
-
 Czechia
-
 DR Congo
-
 Denmark
-
 Dominican Republic
-
 Ecuador
-
 Egypt
-
 El Salvador
-
 Estonia
-
 Eswatini
-
 Ethiopia
-
 Finland
-
 France
-
 Georgia
-
 Germany
-
 Ghana
-
 Greece
-
 Haiti
-
 Hong Kong
-
 Hungary
-
 India
-
 Indonesia
-
 Iran, Islamic republic
-
 Iraq
-
 Ireland
-
 Israel
-
 Italy
-
 Jamaica
-
 Japan
-
 Jordan
-
 Kazakhstan
-
 Kenya
-
 Korea
-
 Kuwait
-
 Kyrgyzstan
-
 Laos
-
 Latvia
-
 Lebanon
-
 Lesotho
-
 Libya
-
 Lithuania
-
 Luxembourg
-
 Madagascar
-
 Malaysia
-
 Malta
-
 Mauritius
-
 Mexico
-
 Moldova
-
 Mongolia
-
 Montenegro
-
 Morocco
-
 Mozambique
-
 Myanmar
-
 Namibia
-
 Nepal
-
 Netherlands
-
 New Zealand
-
 Nigeria
-
 North Macedonia
-
 Norway
-
 Oman
-
 Pakistan
-
 Palestine
-
 Panama
-
 Papua New Guinea
-
 Paraguay
-
 Peru
-
 Philippines
-
 Poland
-
 Portugal
-
 Puerto Rico
-
 Qatar
-
 Reunion
-
 Romania
-
 Rwanda
-
 Saudi Arabia
-
 Serbia
-
 Singapore
-
 Slovakia
-
 Slovenia
-
 Somalia
-
 South Africa
-
 Spain
-
 Sri Lanka
-
 Sweden
-
 Switzerland
-
 Syria
-
 Taiwan
-
 Tajikistan
-
 Tanzania
-
 Thailand
-
 Trinidad and Tobago
-
 Tunisia
-
 Turkey
-
 UAE
-
 Uganda
-
 Ukraine
-
 United Kingdom
-
United States
-
 Uruguay
-
 Uzbekistan
-
 Venezuela
-
 Vietnam
-
 Yemen
-
 Zambia
-
 Zimbabwe
- Forex
- Crypto












