

Intuit stock nears resistance at $357.67 as momentum indicators remain firm: weekly analysis

Shares of Intuit Inc. (INTU) are trading near $357 after climbing about 4.5% over the past week, as a strong rally faces signals of short-term overheating. While daily momentum indicators remain firm, overbought conditions introduce risks of a technical pullback or stall in gains heading into the week ahead.
 348.54
366.19
Highlights
- Shares of Intuit rose 4.55% in the past week to $356.65, reaching the upper end of the recent trading range.
- The stock is positioned above near-term moving averages but is currently testing key long-term resistance at the 200-day average of $357.67.
- Momentum indicators show sustained buying and overbought conditions, with an expected price range of $338 to $382.15 and a 79% probability of further gains.
AI-driven launches and acquisitions boost sentiment amid shifting holdings
Intuit's rollout of new AI-driven features across QuickBooks, Enterprise Suite, and accountant tools has positioned the company at the forefront of accounting automation, according to Yahoo Finance and Simply Wall St. Last week's Intuit Connect 2026 event showcased agentic AI tools and a more unified advisory platform, with CPA Practice Advisor noting the focus on automation for professionals. The recent acquisition of Sequence expands the company's AI-enabled automation portfolio, while regulatory filings point to shifting institutional holdings (source: The Motley Fool).
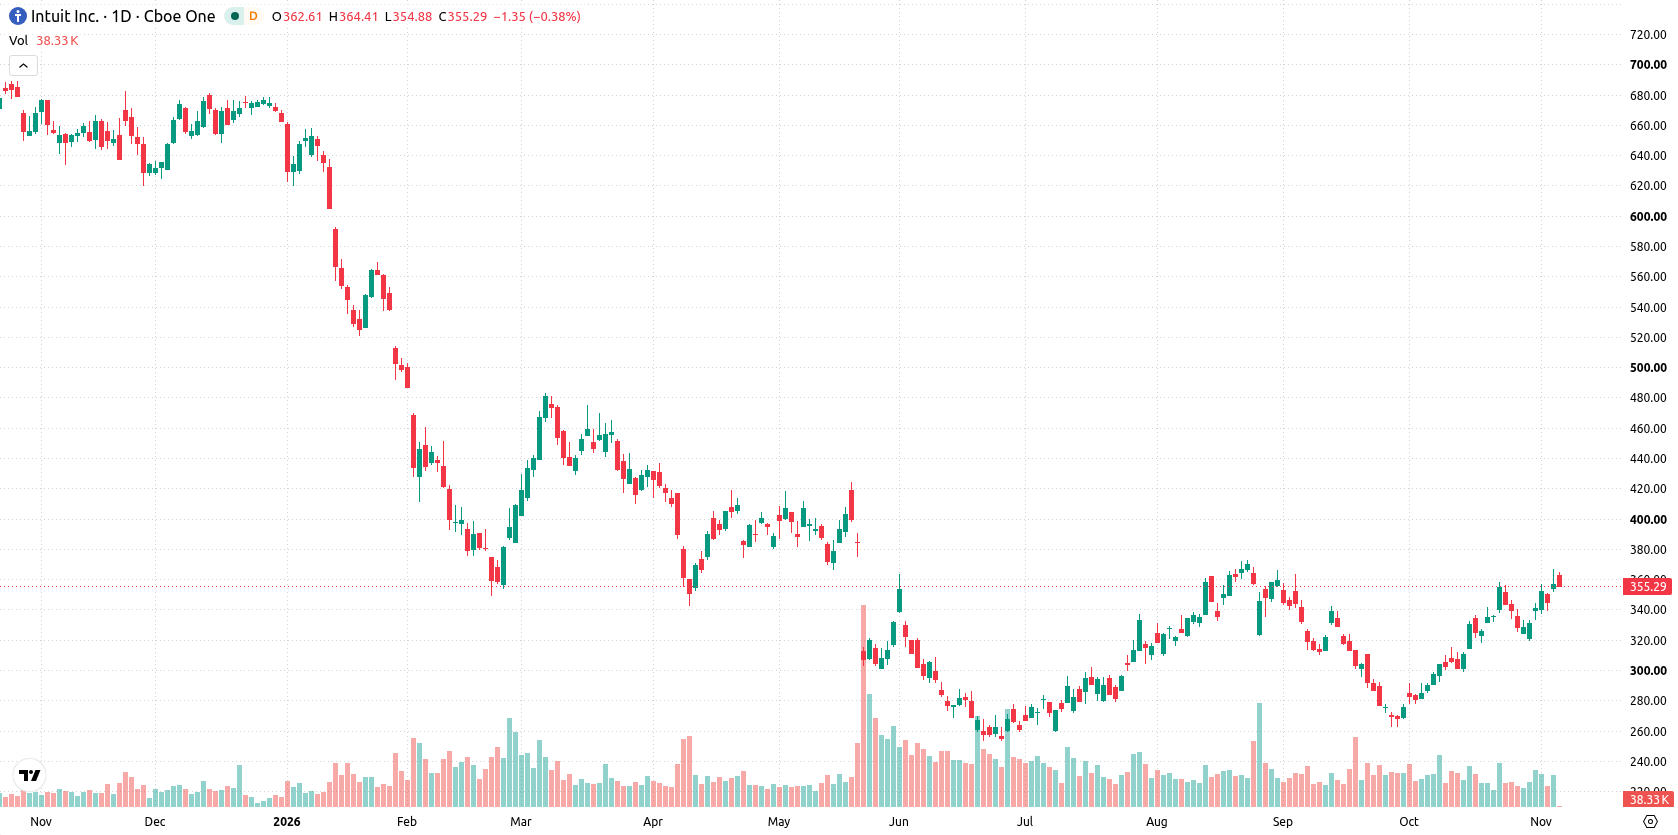
Momentum remains strong this week as technicals flag overbought risk
On the daily chart, structure remains strong with a trending profile and a sustained move higher with a firm trend, assisted by recent volatility at 12.85%. MACD and ADX both signal ongoing buying momentum, while CCI is overbought at 148.35, highlighting potential correction risk ahead. Nearest support is found at $329.94, with resistance defined by the 200-day average at $357.67. The risk of short-term overheating will be defined by price action around these levels.
Consolidation or upside bias expected next week amid breakout potential
For the next five trading days, the expected range is $338 to $382.15. There is a 79% probability of an increase and a 21% chance of a decrease. The base case anticipates consolidation or continued upside below resistance at $357.67. A breakout above this level would open the way toward the upper boundary of the forecast range, while failure to hold above support at $329.94 would raise the risk of a deeper pullback.
Earlier, analysts noted that Intuit's momentum was driven by robust adoption of its AI-powered platform and recent automation-focused acquisitions, while still contending with technical resistance levels. The current setup strengthens this outlook, as sustained buying momentum and new AI-driven feature rollouts position Intuit for potential upside continuation, with traders advised to monitor for a confirmed breakout above $357.67 to signal the next leg higher.










-
 Afghanistan
-
 Albania
-
 Algeria
-
 Angola
-
 Argentina
-
 Armenia
-
 Australia
-
 Austria
-
 Azerbaijan
-
 Bahamas
-
 Bahrain
-
 Bangladesh
-
 Belarus
-
 Belgium
-
 Bolivia
-
 Botswana
-
 Brazil
-
 Brunei
-
 Bulgaria
-
 Cambodia
-
 Cameroon
-
 Canada
-
 Chile
-
 China
-
 Colombia
-
 Congo
-
 Costa Rica
-
 Cote d'Ivoire
-
 Croatia
-
 Cuba
-
 Cyprus
-
 Czechia
-
 DR Congo
-
 Denmark
-
 Dominican Republic
-
 Ecuador
-
 Egypt
-
 El Salvador
-
 Estonia
-
 Eswatini
-
 Ethiopia
-
 Finland
-
 France
-
 Georgia
-
 Germany
-
 Ghana
-
 Greece
-
 Haiti
-
 Hong Kong
-
 Hungary
-
 India
-
 Indonesia
-
 Iran, Islamic republic
-
 Iraq
-
 Ireland
-
 Israel
-
 Italy
-
 Jamaica
-
 Japan
-
 Jordan
-
 Kazakhstan
-
 Kenya
-
 Korea
-
 Kuwait
-
 Kyrgyzstan
-
 Laos
-
 Latvia
-
 Lebanon
-
 Lesotho
-
 Libya
-
 Lithuania
-
 Luxembourg
-
 Madagascar
-
 Malaysia
-
 Malta
-
 Mauritius
-
 Mexico
-
 Moldova
-
 Mongolia
-
 Montenegro
-
 Morocco
-
 Mozambique
-
 Myanmar
-
 Namibia
-
 Nepal
-
 Netherlands
-
 New Zealand
-
 Nigeria
-
 North Macedonia
-
 Norway
-
 Oman
-
 Pakistan
-
 Palestine
-
 Panama
-
 Papua New Guinea
-
 Paraguay
-
 Peru
-
 Philippines
-
 Poland
-
 Portugal
-
 Puerto Rico
-
 Qatar
-
 Reunion
-
 Romania
-
 Rwanda
-
 Saudi Arabia
-
 Serbia
-
 Singapore
-
 Slovakia
-
 Slovenia
-
 Somalia
-
 South Africa
-
 Spain
-
 Sri Lanka
-
 Sweden
-
 Switzerland
-
 Syria
-
 Taiwan
-
 Tajikistan
-
 Tanzania
-
 Thailand
-
 Trinidad and Tobago
-
 Tunisia
-
 Turkey
-
 UAE
-
 Uganda
-
 Ukraine
-
 United Kingdom
-
United States
-
 Uruguay
-
 Uzbekistan
-
 Venezuela
-
 Vietnam
-
 Yemen
-
 Zambia
-
 Zimbabwe
- Forex
- Crypto












