

Intuit stock steadies near 20-day average amid conflicting technical indicators: weekly analysis

Shares of Intuit Inc. (INTU) are trading near $342 and holding their range, as conflicting technical signals shape the weekly setup. The chart shows price stability with mixed momentum readings, putting focus on the key support and resistance levels for the days ahead.
 345.68
Highlights
- Shares of Intuit closed at $341.71, with minor gains of $0.21 over the past week, and the stock consolidates near its 20-day moving average but remains below the 200-day.
- Technical indicators display mixed signals, with short-term price stability and the potential for a rebound as the stock tests resistance at $345.68.
- For the next five trading days, shares are projected to trade between $336.58 and $363.53, with a 76% probability of an upward move and $340.83 as key near-term support.
Earnings anticipation and AI partnership steer flows amid tokenization skepticism
Intuit is scheduled to report its Q1 2027 earnings after the market closes on November 19, according to MarketBeat. Aberdeen Group plc disclosed the sale of 110,763 shares of Intuit during the third quarter, as reported by MarketBeat. The week also saw media note Intuit’s resistance to stock tokenization initiatives and highlight its new artificial intelligence partnership aimed at enhancing mid-market business offerings.
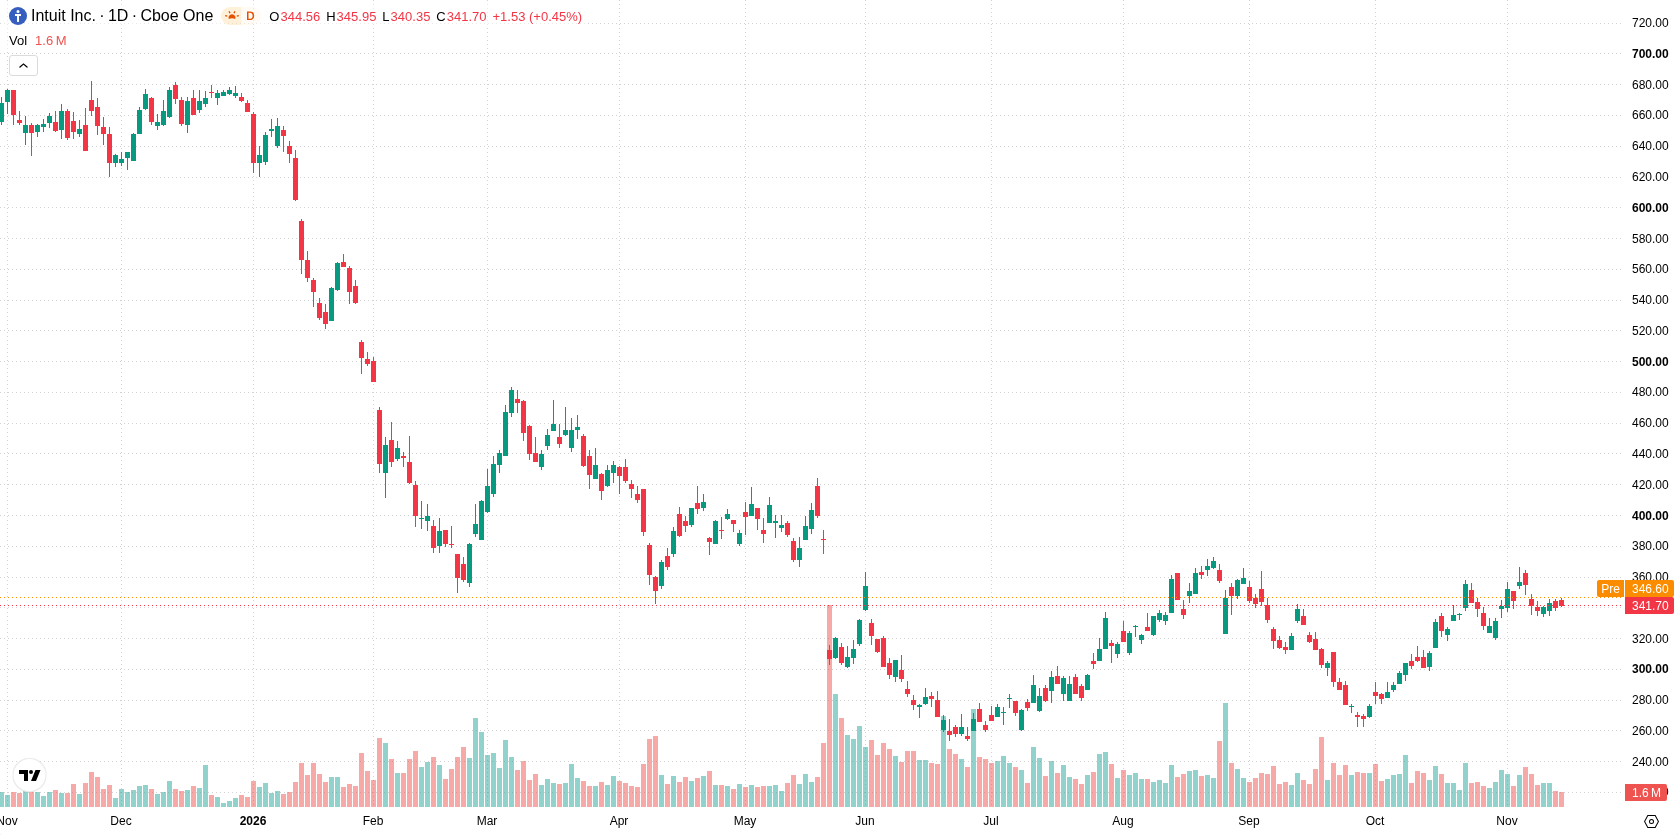
Mixed signals drive indecision as price steadies near 20-day average
On the daily chart, the setup is defined by price stability at the 20-day moving average, as the stock holds steady despite 3.43% weekly volatility and tests near-term resistance at $345.68. Momentum signals are mixed: the MACD points to continued upward bias with a value of 7.88, while the Stochastic RSI is in the oversold zone at 11.66, indicating potential for a short-term rebound. Other daily oscillators remain neutral, and ADX shows an emerging move that is not yet confirmed. Key support lies at $340.83, with further backing from the Ichimoku Kijun at $333.32, while resistance is seen at the recent high of $345.68.
Upside favored in coming week if resistance breaks; downside risk if support fails
For the next five trading days, the expected range is $336.58 to $363.53, with a 76% probability of an upward move and 24% probability of a decline. The base case is for the stock to trade between the identified support and resistance, consolidating around these levels. A sustained break above $345.68 would open potential for upside momentum toward the top end of the range. Failure to hold $340.83 could expose shares to a deeper pullback toward $336.58 and the Ichimoku Kijun level.
Previously it was reported that Intuit is advancing its strategy to unify its product portfolio through increased corporate branding and new AI initiatives, aiming to position itself as a comprehensive financial platform. Recent technical signals and a focus on upcoming earnings introduce a tactical layer, making the $345.68 resistance level pivotal for traders assessing potential upside in the near term.











-
 Afghanistan
-
 Albania
-
 Algeria
-
 Angola
-
 Argentina
-
 Armenia
-
 Australia
-
 Austria
-
 Azerbaijan
-
 Bahamas
-
 Bahrain
-
 Bangladesh
-
 Belarus
-
 Belgium
-
 Bolivia
-
 Botswana
-
 Brazil
-
 Brunei
-
 Bulgaria
-
 Cambodia
-
 Cameroon
-
 Canada
-
 Chile
-
 China
-
 Colombia
-
 Congo
-
 Costa Rica
-
 Cote d'Ivoire
-
 Croatia
-
 Cuba
-
 Cyprus
-
 Czechia
-
 DR Congo
-
 Denmark
-
 Dominican Republic
-
 Ecuador
-
 Egypt
-
 El Salvador
-
 Estonia
-
 Eswatini
-
 Ethiopia
-
 Finland
-
 France
-
 Georgia
-
 Germany
-
 Ghana
-
 Greece
-
 Haiti
-
 Hong Kong
-
 Hungary
-
 India
-
 Indonesia
-
 Iran, Islamic republic
-
 Iraq
-
 Ireland
-
 Israel
-
 Italy
-
 Jamaica
-
 Japan
-
 Jordan
-
 Kazakhstan
-
 Kenya
-
 Korea
-
 Kuwait
-
 Kyrgyzstan
-
 Laos
-
 Latvia
-
 Lebanon
-
 Lesotho
-
 Libya
-
 Lithuania
-
 Luxembourg
-
 Madagascar
-
 Malaysia
-
 Malta
-
 Mauritius
-
 Mexico
-
 Moldova
-
 Mongolia
-
 Montenegro
-
 Morocco
-
 Mozambique
-
 Myanmar
-
 Namibia
-
 Nepal
-
 Netherlands
-
 New Zealand
-
 Nigeria
-
 North Macedonia
-
 Norway
-
 Oman
-
 Pakistan
-
 Palestine
-
 Panama
-
 Papua New Guinea
-
 Paraguay
-
 Peru
-
 Philippines
-
 Poland
-
 Portugal
-
 Puerto Rico
-
 Qatar
-
 Reunion
-
 Romania
-
 Rwanda
-
 Saudi Arabia
-
 Serbia
-
 Singapore
-
 Slovakia
-
 Slovenia
-
 Somalia
-
 South Africa
-
 Spain
-
 Sri Lanka
-
 Sweden
-
 Switzerland
-
 Syria
-
 Taiwan
-
 Tajikistan
-
 Tanzania
-
 Thailand
-
 Trinidad and Tobago
-
 Tunisia
-
 Turkey
-
 UAE
-
 Uganda
-
 Ukraine
-
 United Kingdom
-
United States
-
 Uruguay
-
 Uzbekistan
-
 Venezuela
-
 Vietnam
-
 Yemen
-
 Zambia
-
 Zimbabwe
- Forex
- Crypto












