

NEM slides more than 4% as stock slips below 20-day average and selling persists

Newmont Corporation (NEM) fell 4.31% after renewed selling pressure dominated the session, with sentiment weighed down by confirmation that Envestnet Asset Management Inc. reduced its stake in the company. The decline is further supported by the stock slipping below its 20-day moving average, signaling intensified short-term weakness despite a constructive medium-term technical backdrop.
 108.07
113.96
Highlights
- Newmont will release its third quarter 2026 financial results after the North American market close on October 22, 2026.
- Envestnet Asset Management Inc. reduced its holdings in Newmont by 8.2% during the second quarter amid ongoing selling pressure.
- Shares of Newmont last traded at $116.18, showing short-term selling pressure with an expected five-day range of $112.19 to $120.18 and mixed technical momentum.
Investor day and stake reduction reinforce ongoing downside sentiment
Newmont announced it will release its third quarter 2026 financial results after North American markets close on October 22, 2026, accompanied by an investor webcast later that day. The event was authorized by Senior Vice President and Corporate Secretary Logan Hennessey. In addition, Envestnet Asset Management Inc. was reported to have reduced its holdings in Newmont by 8.2% during the second quarter, though price action has remained under broader selling pressure.
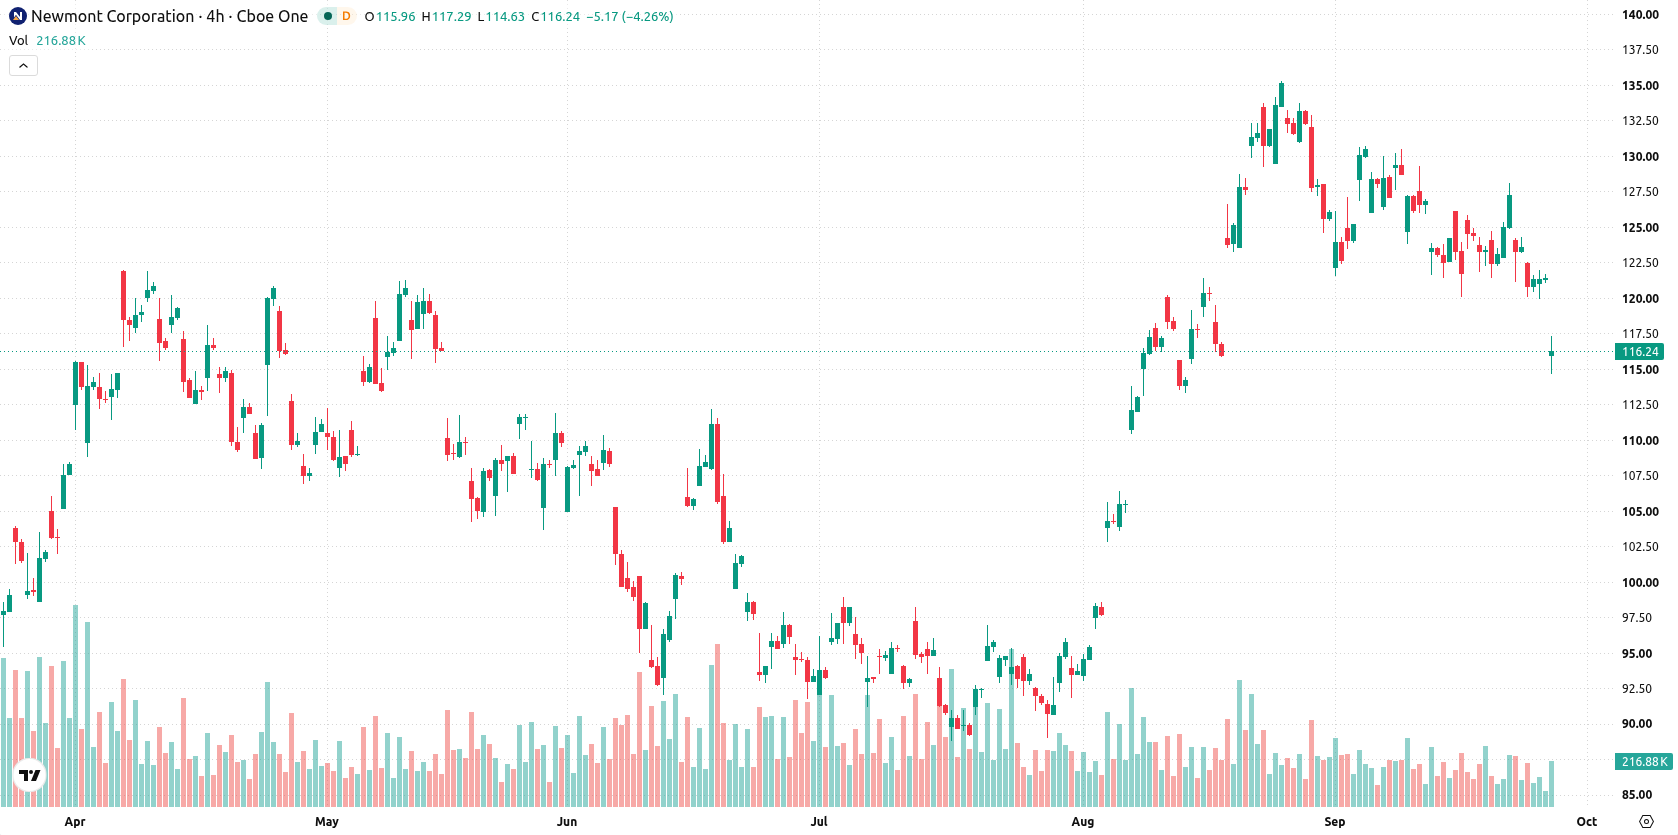
Mixed momentum signals amid short-term selling and long-term support
Newmont is currently trading below its 20-day moving average at $125.13, but it remains above the 50-day at $115.5 and the 200-day at $111.04. This configuration indicates short-term seller strength, even as the medium- and long-term trend remains bullish. The closest resistance is found at $120.06, with key support at $115.5. Momentum signals are mixed: the MACD points to strong upside potential and the ADX supports a bullish bias. However, with the RSI at 48.2 and the Awesome Oscillator indicating selling momentum, along with the CCI and Stochastic RSI in oversold territory, bearish oscillators are clearly present. The BBP at -1.93 highlights dominant selling, and intraday volatility is 1.57%. Divergence persists between the bearish short-term indicators and the constructive longer-term signals.
Earlier, analysts noted that gold miners like Newmont came under pressure as rising bond yields diminished the appeal of non-yielding assets. With short-term indicators still skewed to the downside, a decisive close above $120.18 would be needed to confirm any reversal, making this a key resistance level to monitor in the days ahead.






Latest Newmont Corporation News




-
 Afghanistan
-
 Albania
-
 Algeria
-
 Angola
-
 Argentina
-
 Armenia
-
 Australia
-
 Austria
-
 Azerbaijan
-
 Bahamas
-
 Bahrain
-
 Bangladesh
-
 Belarus
-
 Belgium
-
 Bolivia
-
 Botswana
-
 Brazil
-
 Brunei
-
 Bulgaria
-
 Cambodia
-
 Cameroon
-
 Canada
-
 Chile
-
 China
-
 Colombia
-
 Congo
-
 Costa Rica
-
 Cote d'Ivoire
-
 Croatia
-
 Cuba
-
 Cyprus
-
 Czechia
-
 DR Congo
-
 Denmark
-
 Dominican Republic
-
 Ecuador
-
 Egypt
-
 El Salvador
-
 Estonia
-
 Eswatini
-
 Ethiopia
-
 Finland
-
 France
-
 Georgia
-
 Germany
-
 Ghana
-
 Greece
-
 Haiti
-
 Hong Kong
-
 Hungary
-
 India
-
 Indonesia
-
 Iran, Islamic republic
-
 Iraq
-
 Ireland
-
 Israel
-
 Italy
-
 Jamaica
-
 Japan
-
 Jordan
-
 Kazakhstan
-
 Kenya
-
 Korea
-
 Kuwait
-
 Kyrgyzstan
-
 Laos
-
 Latvia
-
 Lebanon
-
 Lesotho
-
 Libya
-
 Lithuania
-
 Luxembourg
-
 Madagascar
-
 Malaysia
-
 Malta
-
 Mauritius
-
 Mexico
-
 Moldova
-
 Mongolia
-
 Montenegro
-
 Morocco
-
 Mozambique
-
 Myanmar
-
 Namibia
-
 Nepal
-
 Netherlands
-
 New Zealand
-
 Nigeria
-
 North Macedonia
-
 Norway
-
 Oman
-
 Pakistan
-
 Palestine
-
 Panama
-
 Papua New Guinea
-
 Paraguay
-
 Peru
-
 Philippines
-
 Poland
-
 Portugal
-
 Puerto Rico
-
 Qatar
-
 Reunion
-
 Romania
-
 Rwanda
-
 Saudi Arabia
-
 Serbia
-
 Singapore
-
 Slovakia
-
 Slovenia
-
 Somalia
-
 South Africa
-
 Spain
-
 Sri Lanka
-
 Sweden
-
 Switzerland
-
 Syria
-
 Taiwan
-
 Tajikistan
-
 Tanzania
-
 Thailand
-
 Trinidad and Tobago
-
 Tunisia
-
 Turkey
-
 UAE
-
 Uganda
-
 Ukraine
-
 United Kingdom
-
United States
-
 Uruguay
-
 Uzbekistan
-
 Venezuela
-
 Vietnam
-
 Yemen
-
 Zambia
-
 Zimbabwe
- Forex
- Crypto












