

Newmont shares drop about 6.5% after institutional buying is overshadowed by bearish technicals

Newmont Corporation (NEM) dropped 6.47% after gold prices weakened and rate hike expectations pressured the sector, even as a series of institutional investments and recent revenue growth set a constructive backdrop. The decline is further supported by pronounced selling pressure, with the stock trading below all its major moving averages and technical trends turning bearish.
 107.60
116.37
Highlights
- Institutional investors such as Banco Santander S.A. and Stanley Druckenmiller’s family office raised stakes or opened new positions in Newmont.
- Newmont reported revenue growth and its operating margin reached the highest level since late 2016.
- Newmont stock faces pronounced selling pressure, with a projected five-day range of $101 to $107.2 and a 75% probability of a downward move.
Portfolio inflows rise as gold slump fuels selling pressure
Institutional investors, including Banco Santander S.A., HighTower Advisors LLC, and First Eagle Investment Management LLC, increased their positions in Newmont. Stanley Druckenmiller’s family office also took a new stake in the company. Newmont reported revenue growth and its operating margin reached the highest since late 2016. These developments were accompanied by selling linked to falling gold prices and speculation around Federal Reserve rate hikes, though price action has remained under broader selling pressure.
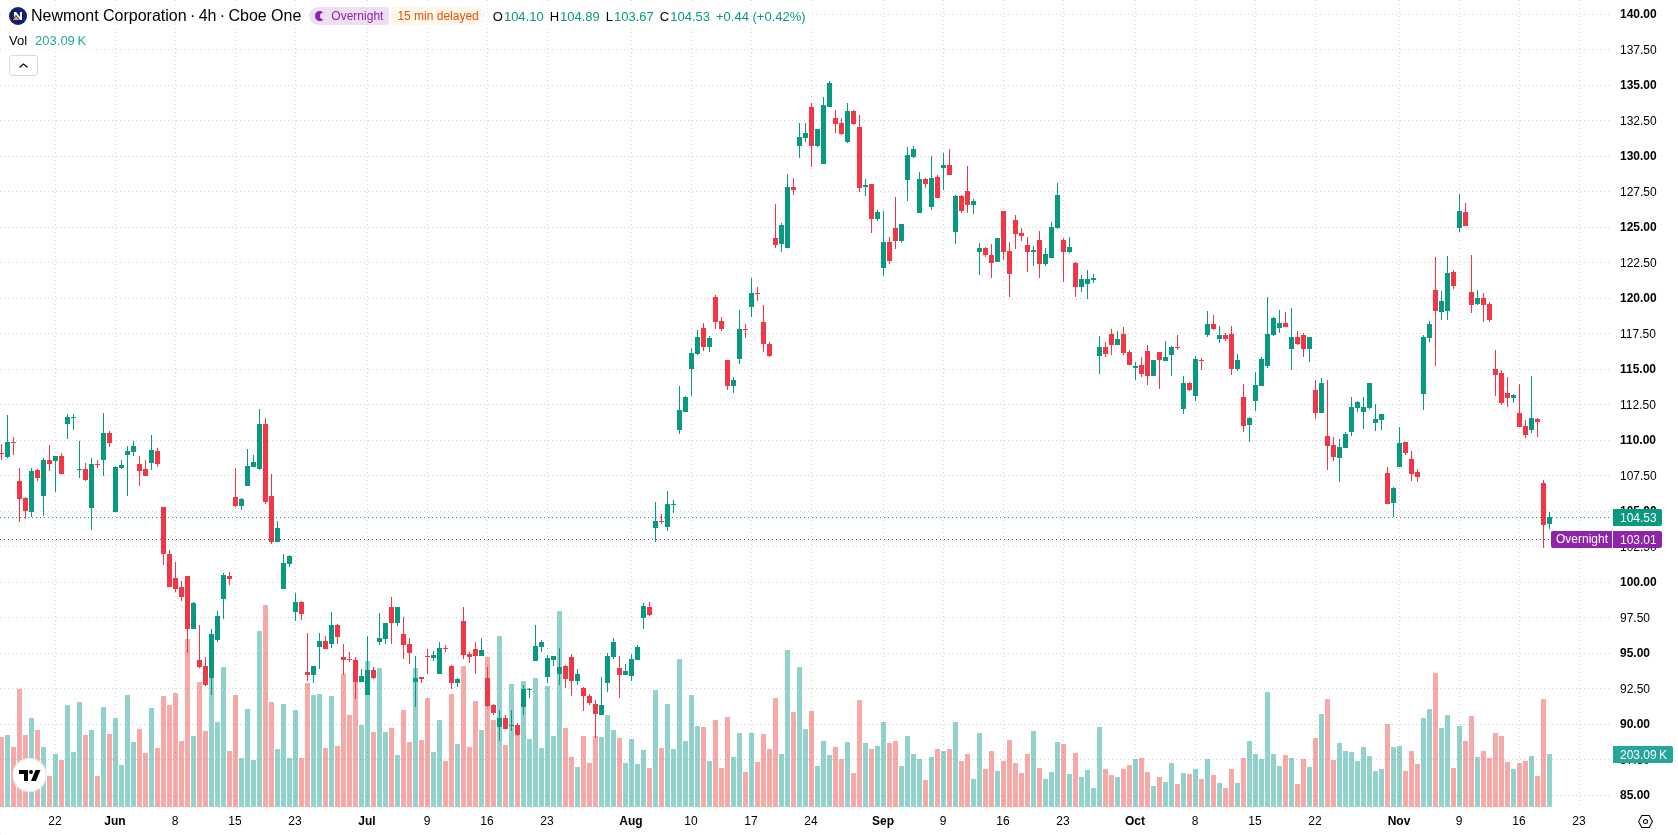
Bearish momentum confirmed as key moving averages break down
Newmont has fallen below its 20-day, 50-day, and 200-day moving averages at $114.09, $117.37, and $112.13, confirming downside momentum across all time frames. The stock is currently facing resistance near $107.2 and support at $101, which points to a narrow trading range. Momentum indicators are predominantly negative: the MACD signals a sell, and the Average Directional Index (ADX) is neutral, highlighting a lack of a strong trend. RSI, Stochastic RSI, and Commodity Channel Index (CCI) remain neutral, indicating neither overbought nor oversold conditions. Intraday momentum remains with sellers, as the Bull/Bear Power (BBP) and Awesome Oscillator both indicate increased selling activity. The stock is trading near session lows, showing heightened intraday volatility at 3.56%.
Earlier, analysts noted that Newmont’s persistent cost inflation and broad-based selling pressure sustained a predominantly bearish technical backdrop. The latest market action reinforces this view, with all key moving averages turning negative and traders now watching for a decisive move below $101 to confirm an extended downside risk.






Latest Newmont Corporation News




-
 Afghanistan
-
 Albania
-
 Algeria
-
 Angola
-
 Argentina
-
 Armenia
-
 Australia
-
 Austria
-
 Azerbaijan
-
 Bahamas
-
 Bahrain
-
 Bangladesh
-
 Belarus
-
 Belgium
-
 Bolivia
-
 Botswana
-
 Brazil
-
 Brunei
-
 Bulgaria
-
 Cambodia
-
 Cameroon
-
 Canada
-
 Chile
-
 China
-
 Colombia
-
 Congo
-
 Costa Rica
-
 Cote d'Ivoire
-
 Croatia
-
 Cuba
-
 Cyprus
-
 Czechia
-
 DR Congo
-
 Denmark
-
 Dominican Republic
-
 Ecuador
-
 Egypt
-
 El Salvador
-
 Estonia
-
 Eswatini
-
 Ethiopia
-
 Finland
-
 France
-
 Georgia
-
 Germany
-
 Ghana
-
 Greece
-
 Haiti
-
 Hong Kong
-
 Hungary
-
 India
-
 Indonesia
-
 Iran, Islamic republic
-
 Iraq
-
 Ireland
-
 Israel
-
 Italy
-
 Jamaica
-
 Japan
-
 Jordan
-
 Kazakhstan
-
 Kenya
-
 Korea
-
 Kuwait
-
 Kyrgyzstan
-
 Laos
-
 Latvia
-
 Lebanon
-
 Lesotho
-
 Libya
-
 Lithuania
-
 Luxembourg
-
 Madagascar
-
 Malaysia
-
 Malta
-
 Mauritius
-
 Mexico
-
 Moldova
-
 Mongolia
-
 Montenegro
-
 Morocco
-
 Mozambique
-
 Myanmar
-
 Namibia
-
 Nepal
-
 Netherlands
-
 New Zealand
-
 Nigeria
-
 North Macedonia
-
 Norway
-
 Oman
-
 Pakistan
-
 Palestine
-
 Panama
-
 Papua New Guinea
-
 Paraguay
-
 Peru
-
 Philippines
-
 Poland
-
 Portugal
-
 Puerto Rico
-
 Qatar
-
 Reunion
-
 Romania
-
 Rwanda
-
 Saudi Arabia
-
 Serbia
-
 Singapore
-
 Slovakia
-
 Slovenia
-
 Somalia
-
 South Africa
-
 Spain
-
 Sri Lanka
-
 Sweden
-
 Switzerland
-
 Syria
-
 Taiwan
-
 Tajikistan
-
 Tanzania
-
 Thailand
-
 Trinidad and Tobago
-
 Tunisia
-
 Turkey
-
 UAE
-
 Uganda
-
 Ukraine
-
 United Kingdom
-
United States
-
 Uruguay
-
 Uzbekistan
-
 Venezuela
-
 Vietnam
-
 Yemen
-
 Zambia
-
 Zimbabwe
- Forex
- Crypto












