

Newmont stock trades lower while sellers dominate the current session

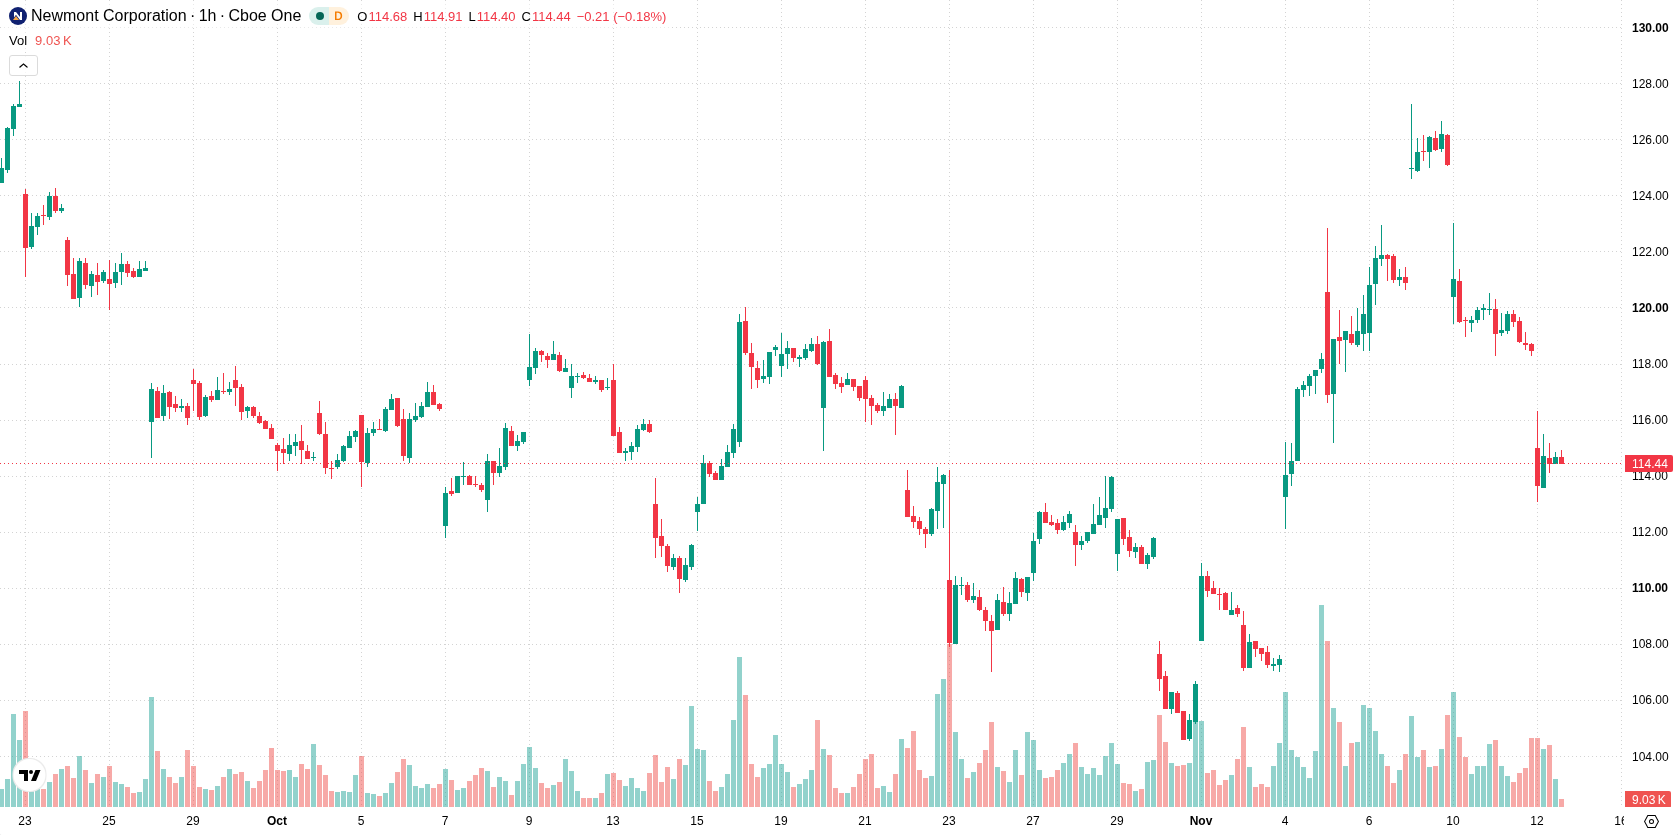
Newmont (NEM) stock is trading at $114, reflecting a daily decline of 3.77%. The price has moved lower and is positioned below its short- and medium-term moving averages, but remains above its longer-term trend levels.
 114.23
116.37
Highlights
- Forest Hill Capital, the New Mexico Educational Retirement Board, and Paradigm Asset Management acquired over 270,000 shares of Newmont Corporation in the third quarter.
- Institutional accumulation of Newmont stock increased, but shares continue to face broad market selling pressure.
- Newmont stock trades below short- and medium-term averages but holds above long-term support, with a forecasted range of $109.98 to $118.02 and high downside probability.
Institutional accumulation rises as stock absorbs persistent selling
Forest Hill Capital LLC purchased 194,750 shares of Newmont Corporation during the third quarter, reflecting an increase in institutional holdings and a direct injection of demand, according to MarketBeat. Public pension fund activity was also recorded as the New Mexico Educational Retirement Board acquired 54,280 shares in the same period, based on reporting from Themarketsdaily. Paradigm Asset Management Co. LLC added 21,200 shares to its portfolio in the third quarter, further marking incremental accumulation by asset managers. These additions to institutional ownership highlight underlying investor participation, though price action has remained under broader selling pressure.
Sustained seller control as momentum weakens below key averages
The $114 level is currently positioned between key technical references, with the price trading below the MA-20 and MA-50 but holding above the MA-200. Immediate resistance is identified at the Ichimoku Kijun, which stands at $122.77. Momentum indicators show a negative bias overall: both RSI and CCI readings are neutral, while the Stochastic RSI is flagged as oversold. MACD is neutral, whereas the ADX and Awesome Oscillator both continue to signal selling pressure; Bull/Bear Power remains negative, indicating seller dominance in the current session.
Bearish break risk rises as rangebound pattern persists
For the coming sessions, the most likely scenario is for price to persist within a sideways range bounded by $109.98 on the downside and $118.02 on the upside. Given the prevailing signals, the probability of a break lower is very high, and the likelihood of an upward move above immediate resistance is considered very low in the current environment. A bullish recovery would require a breakout above the established resistance, while failure to hold the lower boundary would indicate additional downside potential within a typical volatility band.
Earlier, analysts noted that Newmont shares had shown resilience above key moving averages despite periods of heightened volatility and mixed technical momentum. The latest data now signals increased institutional accumulation even as price action deteriorates, making the $109.98 level a critical area for downside risk monitoring in the near term.






Latest Newmont Corporation News




-
 Afghanistan
-
 Albania
-
 Algeria
-
 Angola
-
 Argentina
-
 Armenia
-
 Australia
-
 Austria
-
 Azerbaijan
-
 Bahamas
-
 Bahrain
-
 Bangladesh
-
 Belarus
-
 Belgium
-
 Bolivia
-
 Botswana
-
 Brazil
-
 Brunei
-
 Bulgaria
-
 Cambodia
-
 Cameroon
-
 Canada
-
 Chile
-
 China
-
 Colombia
-
 Congo
-
 Costa Rica
-
 Cote d'Ivoire
-
 Croatia
-
 Cuba
-
 Cyprus
-
 Czechia
-
 DR Congo
-
 Denmark
-
 Dominican Republic
-
 Ecuador
-
 Egypt
-
 El Salvador
-
 Estonia
-
 Eswatini
-
 Ethiopia
-
 Finland
-
 France
-
 Georgia
-
 Germany
-
 Ghana
-
 Greece
-
 Haiti
-
 Hong Kong
-
 Hungary
-
 India
-
 Indonesia
-
 Iran, Islamic republic
-
 Iraq
-
 Ireland
-
 Israel
-
 Italy
-
 Jamaica
-
 Japan
-
 Jordan
-
 Kazakhstan
-
 Kenya
-
 Korea
-
 Kuwait
-
 Kyrgyzstan
-
 Laos
-
 Latvia
-
 Lebanon
-
 Lesotho
-
 Libya
-
 Lithuania
-
 Luxembourg
-
 Madagascar
-
 Malaysia
-
 Malta
-
 Mauritius
-
 Mexico
-
 Moldova
-
 Mongolia
-
 Montenegro
-
 Morocco
-
 Mozambique
-
 Myanmar
-
 Namibia
-
 Nepal
-
 Netherlands
-
 New Zealand
-
 Nigeria
-
 North Macedonia
-
 Norway
-
 Oman
-
 Pakistan
-
 Palestine
-
 Panama
-
 Papua New Guinea
-
 Paraguay
-
 Peru
-
 Philippines
-
 Poland
-
 Portugal
-
 Puerto Rico
-
 Qatar
-
 Reunion
-
 Romania
-
 Rwanda
-
 Saudi Arabia
-
 Serbia
-
 Singapore
-
 Slovakia
-
 Slovenia
-
 Somalia
-
 South Africa
-
 Spain
-
 Sri Lanka
-
 Sweden
-
 Switzerland
-
 Syria
-
 Taiwan
-
 Tajikistan
-
 Tanzania
-
 Thailand
-
 Trinidad and Tobago
-
 Tunisia
-
 Turkey
-
 UAE
-
 Uganda
-
 Ukraine
-
 United Kingdom
-
United States
-
 Uruguay
-
 Uzbekistan
-
 Venezuela
-
 Vietnam
-
 Yemen
-
 Zambia
-
 Zimbabwe
- Forex
- Crypto












