

What's behind Newmont's latest 4.9% stock pullback?

Newmont Corporation (NEM) slid 4.91% after reporting increased sales costs for the third quarter and updating cost guidance, even as robust capital returns and mine expansion progress continued. The decline is further supported by the stock remaining below its short- and medium-term moving averages, highlighting persistent selling pressure despite long-term structure stability.
 99.64
114.47
Highlights
- Newmont generated $7.3 billion in free cash flow over nine months and is advancing the Tanami Expansion 2 project ahead of schedule for 2027 production.
- The company repurchased $1.6 billion in stock since its last earnings call, cutting share count by 10% since February 2024, and declared a $0.26 dividend despite rising costs.
- Shares of Newmont trade below key short- and medium-term averages with mixed momentum signals, an expected five-day range of $108.16 to $117.15, and 72% probability of an upward move.
Investor positioning rises amid cost inflation and persistent selling pressure
Newmont reported $7.3 billion in free cash flow over the first nine months of 2026, allocating funds toward mine development and progressing the Tanami Expansion 2 project ahead of schedule with commercial production expected in the first half of 2027. The company repurchased $1.6 billion in common stock since the last earnings call and declared a quarterly dividend of $0.26 per share, reducing the share count by around 10% since February 2024. Third quarter 2026 financials showed a 22% year-over-year rise in costs applicable to sales to $1,449 per ounce and all-in sustaining costs rising to $1,963 per ounce, with updated by-product AISC guidance for 2026 now at $1,520 per ounce. Institutional investors including Forest Hill Capital LLC, Ethic Inc., Paradigm Asset Management, Philadelphia Trust Co., Knights of Columbus Asset Advisors, and Retirement Systems of Alabama disclosed new positions in Newmont, though price action has remained under broader selling pressure.
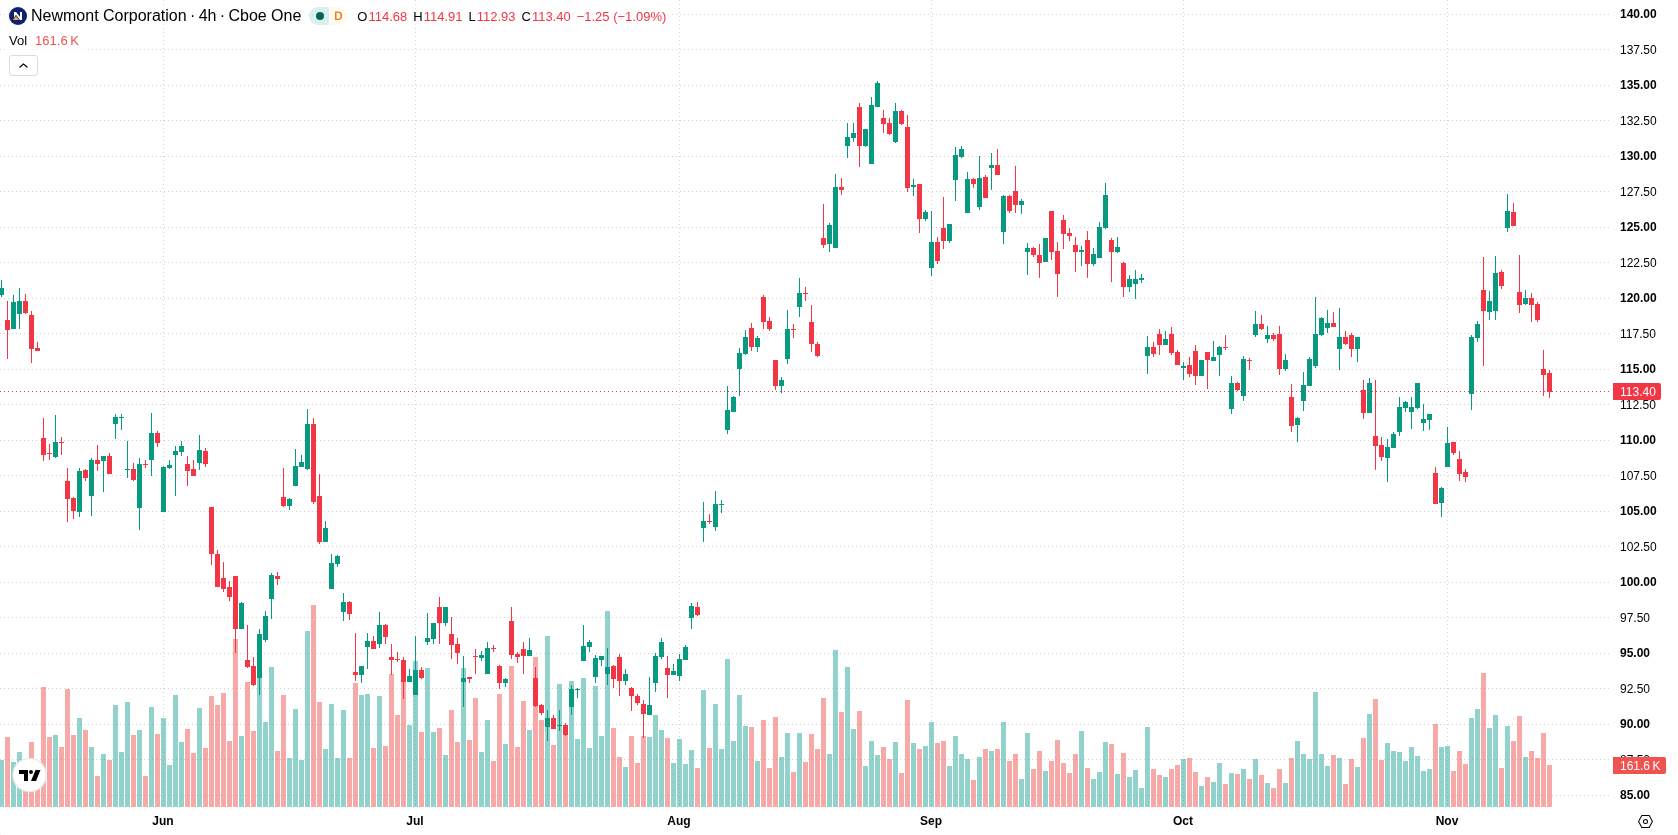
Short- and medium-term bearish control as mixed momentum clouds support
NEM is trading below its 20-day and 50-day moving averages at $115.22 and $118.65, but remains above the 200-day moving average at $112.32, indicating that sellers control the short- and medium-term trend, while the long-term structure is modestly constructive. Immediate resistance is marked at $113.05 with support close at $112.32, and the Ichimoku Kijun at $115.9 provides additional resistance. Momentum signals are mixed: MACD, ADX, RSI, Stochastic RSI, and CCI are neutral, while Bull/Bear Power (BBP) is positive at 3.31 and the Awesome Oscillator points to recent upward intraday bias. The stock registered a downside gap and is trading near session lows, with intraday volatility at 2.94%. BBP and AO suggest some buying activity, but overall momentum signals lack consensus.
Earlier, analysts noted that Newmont’s stock persisted under broad selling pressure despite signs of increasing institutional accumulation. The latest data adds a new dimension with cost inflation intensifying downside risk, making sustained support at $112.32 a critical focus for traders monitoring potential further weakness in the near term.






Latest Newmont Corporation News




-
 Afghanistan
-
 Albania
-
 Algeria
-
 Angola
-
 Argentina
-
 Armenia
-
 Australia
-
 Austria
-
 Azerbaijan
-
 Bahamas
-
 Bahrain
-
 Bangladesh
-
 Belarus
-
 Belgium
-
 Bolivia
-
 Botswana
-
 Brazil
-
 Brunei
-
 Bulgaria
-
 Cambodia
-
 Cameroon
-
 Canada
-
 Chile
-
 China
-
 Colombia
-
 Congo
-
 Costa Rica
-
 Cote d'Ivoire
-
 Croatia
-
 Cuba
-
 Cyprus
-
 Czechia
-
 DR Congo
-
 Denmark
-
 Dominican Republic
-
 Ecuador
-
 Egypt
-
 El Salvador
-
 Estonia
-
 Eswatini
-
 Ethiopia
-
 Finland
-
 France
-
 Georgia
-
 Germany
-
 Ghana
-
 Greece
-
 Haiti
-
 Hong Kong
-
 Hungary
-
 India
-
 Indonesia
-
 Iran, Islamic republic
-
 Iraq
-
 Ireland
-
 Israel
-
 Italy
-
 Jamaica
-
 Japan
-
 Jordan
-
 Kazakhstan
-
 Kenya
-
 Korea
-
 Kuwait
-
 Kyrgyzstan
-
 Laos
-
 Latvia
-
 Lebanon
-
 Lesotho
-
 Libya
-
 Lithuania
-
 Luxembourg
-
 Madagascar
-
 Malaysia
-
 Malta
-
 Mauritius
-
 Mexico
-
 Moldova
-
 Mongolia
-
 Montenegro
-
 Morocco
-
 Mozambique
-
 Myanmar
-
 Namibia
-
 Nepal
-
 Netherlands
-
 New Zealand
-
 Nigeria
-
 North Macedonia
-
 Norway
-
 Oman
-
 Pakistan
-
 Palestine
-
 Panama
-
 Papua New Guinea
-
 Paraguay
-
 Peru
-
 Philippines
-
 Poland
-
 Portugal
-
 Puerto Rico
-
 Qatar
-
 Reunion
-
 Romania
-
 Rwanda
-
 Saudi Arabia
-
 Serbia
-
 Singapore
-
 Slovakia
-
 Slovenia
-
 Somalia
-
 South Africa
-
 Spain
-
 Sri Lanka
-
 Sweden
-
 Switzerland
-
 Syria
-
 Taiwan
-
 Tajikistan
-
 Tanzania
-
 Thailand
-
 Trinidad and Tobago
-
 Tunisia
-
 Turkey
-
 UAE
-
 Uganda
-
 Ukraine
-
 United Kingdom
-
United States
-
 Uruguay
-
 Uzbekistan
-
 Venezuela
-
 Vietnam
-
 Yemen
-
 Zambia
-
 Zimbabwe
- Forex
- Crypto












