

NEM slides over 4% as bullish momentum indicators are offset by sharp downside gap

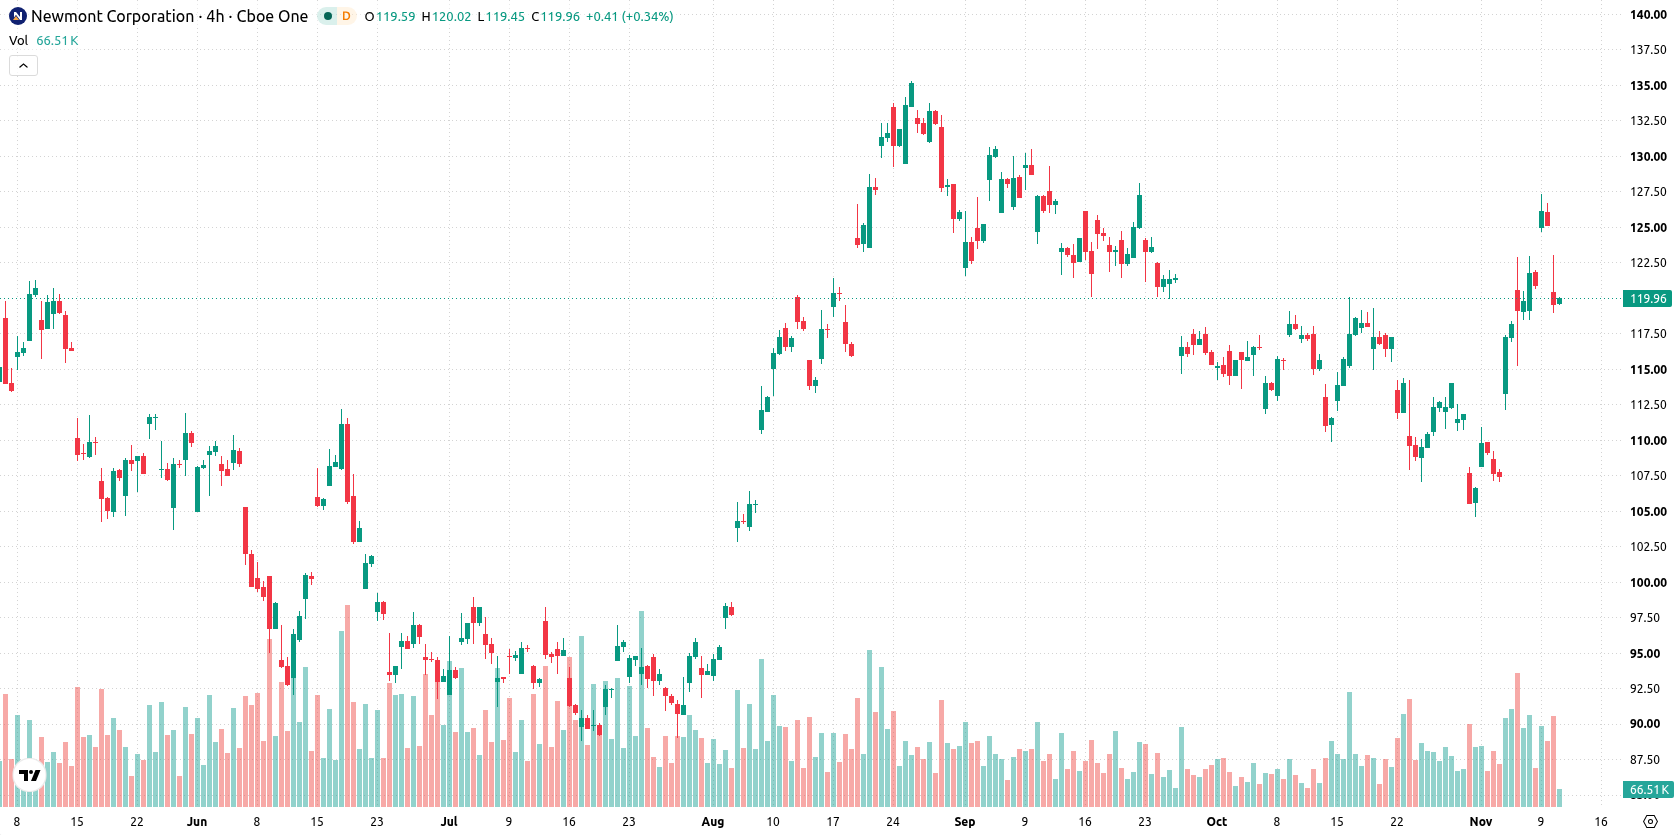
Newmont Corporation (NEM) fell 4.3% after opening sharply lower, with the move occurring even as a backdrop of strong year-to-date results and recent institutional inflows was reported. The selloff stands in contrast to bullish technical signals, which show the stock trading above all key moving averages and testing overhead resistance.
 114.38
127.18
Highlights
- Institutional investors including Euro Pacific Asset Management, AEGON Asset Management UK, and Kestra Advisory Services acquired new positions in Newmont during the third quarter.
- Newmont reported annual revenue of $22.67 billion and net profit of $7.08 billion, with share buybacks totaling $1.9 billion since the previous earnings call.
- Newmont stock is in a bullish trend above key technical levels, with the next five-day expected price range at $112.28 to $127.28 and a high likelihood of price consolidation or rebound.
Institutional buying and executive share sale shape sentiment amid ongoing buybacks
Several institutional investors, including Euro Pacific Asset Management, AEGON Asset Management UK, and Kestra Advisory Services, acquired new positions in Newmont during the third quarter. The company reported annual revenue of $22.67 billion and net profit of $7.08 billion, along with a quarterly dividend declaration and ongoing share buybacks totaling approximately $1.9 billion since the previous earnings call. The CEO executed a $2.9 million share sale under a prearranged plan, though price action has remained under broader selling pressure.
Mixed momentum and overbought signals despite trading above key averages
Newmont is trading above its 20-day, 50-day, and 200-day moving averages, indicating a broadly bullish trend across short, medium, and long timeframes. The price sits at $119.78, with support at $118.94 and resistance at $122.91. Momentum indicators are mixed: MACD and Average Directional Index (ADX) remain neutral, and the Relative Strength Index (RSI) is also neutral. The Stochastic RSI and Commodity Channel Index (CCI) are both in the overbought zone, suggesting a risk of short-term overheating. Bull/Bear Power (BBP) is strongly positive, reflecting sustained buyer interest on an intraday basis, and the Awesome Oscillator also signals bullish momentum. Despite these bullish technical markers, the stock experienced a downside gap of $4.73 (3.78%) and is trading near session lows amid heightened intraday volatility of 3.34%.
Previously it was reported that Barrick Mining Corp. and Newmont reached an agreement to transfer a stake in the Fourmile gold deposit prompting a reassessment of development plans for this major Nevada asset. For Newmont shares, near-term price action may remain volatile, with $118.94 and $122.91 serving as key technical levels to watch for both potential downside acceleration and a move toward the upper trading band.






Latest Newmont Corporation News





-
 Afghanistan
-
 Albania
-
 Algeria
-
 Angola
-
 Argentina
-
 Armenia
-
 Australia
-
 Austria
-
 Azerbaijan
-
 Bahamas
-
 Bahrain
-
 Bangladesh
-
 Belarus
-
 Belgium
-
 Bolivia
-
 Botswana
-
 Brazil
-
 Brunei
-
 Bulgaria
-
 Cambodia
-
 Cameroon
-
 Canada
-
 Chile
-
 China
-
 Colombia
-
 Congo
-
 Costa Rica
-
 Cote d'Ivoire
-
 Croatia
-
 Cuba
-
 Cyprus
-
 Czechia
-
 DR Congo
-
 Denmark
-
 Dominican Republic
-
 Ecuador
-
 Egypt
-
 El Salvador
-
 Estonia
-
 Eswatini
-
 Ethiopia
-
 Finland
-
 France
-
 Georgia
-
 Germany
-
 Ghana
-
 Greece
-
 Haiti
-
 Hong Kong
-
 Hungary
-
 India
-
 Indonesia
-
 Iran, Islamic republic
-
 Iraq
-
 Ireland
-
 Israel
-
 Italy
-
 Jamaica
-
 Japan
-
 Jordan
-
 Kazakhstan
-
 Kenya
-
 Korea
-
 Kuwait
-
 Kyrgyzstan
-
 Laos
-
 Latvia
-
 Lebanon
-
 Lesotho
-
 Libya
-
 Lithuania
-
 Luxembourg
-
 Madagascar
-
 Malaysia
-
 Malta
-
 Mauritius
-
 Mexico
-
 Moldova
-
 Mongolia
-
 Montenegro
-
 Morocco
-
 Mozambique
-
 Myanmar
-
 Namibia
-
 Nepal
-
 Netherlands
-
 New Zealand
-
 Nigeria
-
 North Macedonia
-
 Norway
-
 Oman
-
 Pakistan
-
 Palestine
-
 Panama
-
 Papua New Guinea
-
 Paraguay
-
 Peru
-
 Philippines
-
 Poland
-
 Portugal
-
 Puerto Rico
-
 Qatar
-
 Reunion
-
 Romania
-
 Rwanda
-
 Saudi Arabia
-
 Serbia
-
 Singapore
-
 Slovakia
-
 Slovenia
-
 Somalia
-
 South Africa
-
 Spain
-
 Sri Lanka
-
 Sweden
-
 Switzerland
-
 Syria
-
 Taiwan
-
 Tajikistan
-
 Tanzania
-
 Thailand
-
 Trinidad and Tobago
-
 Tunisia
-
 Turkey
-
 UAE
-
 Uganda
-
 Ukraine
-
 United Kingdom
-
United States
-
 Uruguay
-
 Uzbekistan
-
 Venezuela
-
 Vietnam
-
 Yemen
-
 Zambia
-
 Zimbabwe
- Forex
- Crypto












