

Bakkt stock drops more than 4% after ongoing selling pressure and bearish trend signals

Bakkt Holdings (BKKT) fell 4.31% after an initial downside gap, as persistent selling pressure and near-term resistance at $8.18 continue to weigh on the price. The move is supported by the technical structure, with the asset trading below key moving averages signaling a lingering bearish trend.
 3.66
4.84
Highlights
- Shares of Bakkt closed at $8.15, down 4.31% after a downside gap of $0.19 with intraday volatility near 5%.
- The stock remains below its 20-day and 200-day moving averages, keeping long-term momentum weak with modest medium-term strength above the 50-day average.
- Key technical range for the next five sessions is $7.47 to $8.84, with a baseline scenario favoring sideways consolidation around current levels.
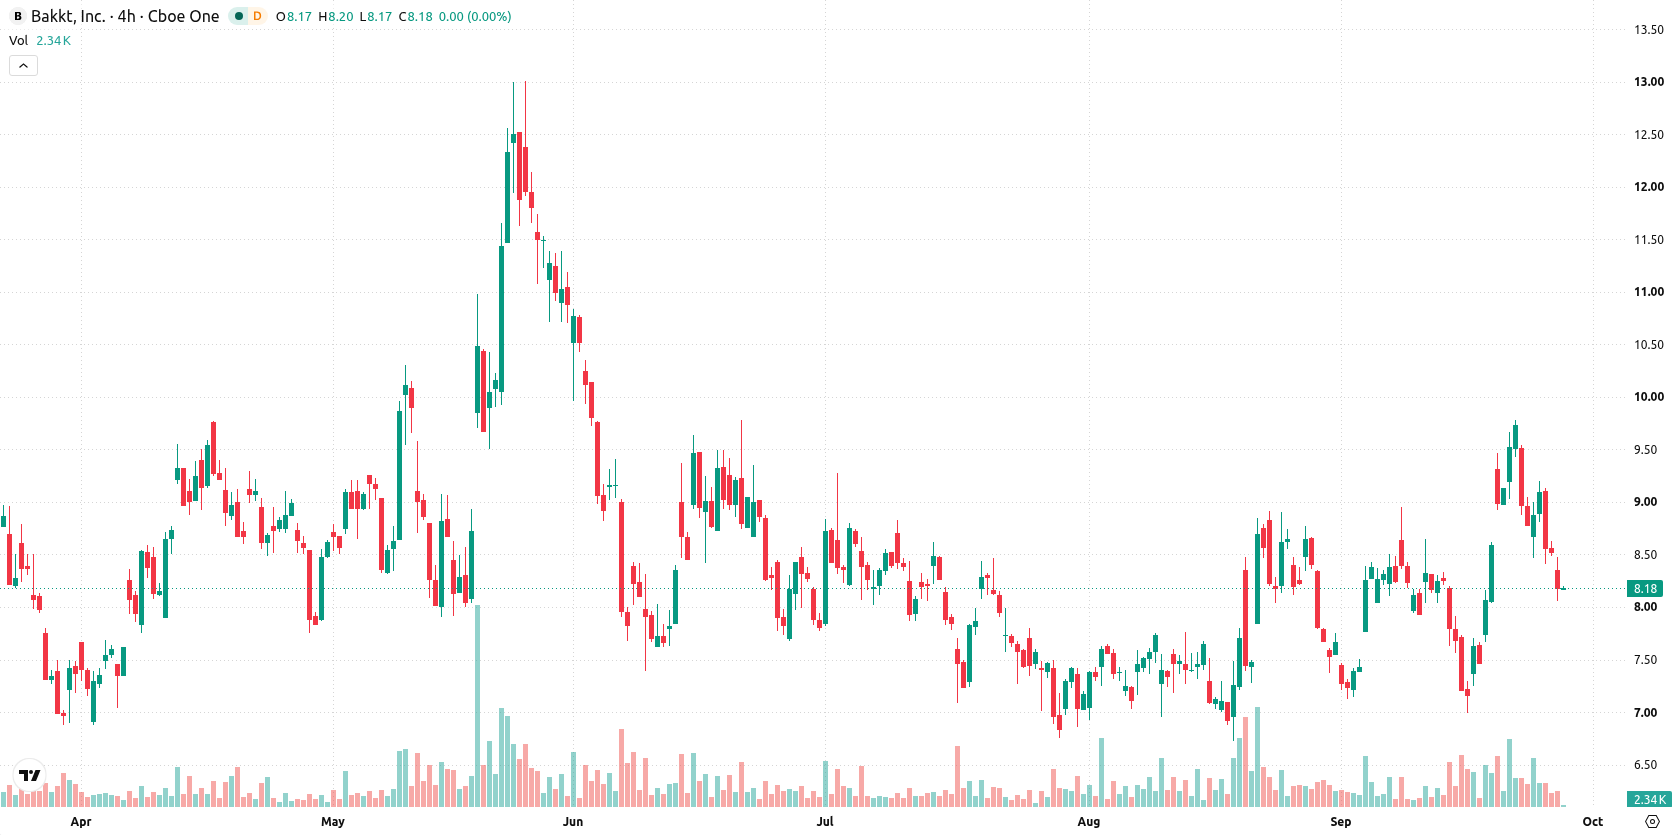
Mixed signals as moving averages diverge and momentum remains weak
Bakkt is trading below its 20-day moving average (MA-20) at $8.18 and its 200-day moving average (MA-200) at $9.69, but remains above the 50-day moving average (MA-50) at $7.85. This arrangement points to ongoing near-term resistance at $8.18, modest medium-term strength, and a persisting long-term bearish alignment. Intraday support is found near today’s low at $8.06. Momentum indicators are mixed: MACD suggests buying momentum, while a low ADX of 13.69 reflects a weak trend. RSI at 52.2 and CCI at 67.87 both imply buying, whereas Stochastic RSI is neutral. Bull/Bear Power at 0.69 confirms intraday buying dominance but highlights an overbought condition, further supported by the Awesome Oscillator.
Earlier, analysts noted that Bakkt was experiencing sustained bearish momentum with elevated downside risk. The current analysis adds a mixed momentum outlook and highlights $8.18 as a key resistance level, making a confirmed break above this price an important trigger for a potential shift in trading direction.









-
 Afghanistan
-
 Albania
-
 Algeria
-
 Angola
-
 Argentina
-
 Armenia
-
 Australia
-
 Austria
-
 Azerbaijan
-
 Bahamas
-
 Bahrain
-
 Bangladesh
-
 Belarus
-
 Belgium
-
 Bolivia
-
 Botswana
-
 Brazil
-
 Brunei
-
 Bulgaria
-
 Cambodia
-
 Cameroon
-
 Canada
-
 Chile
-
 China
-
 Colombia
-
 Congo
-
 Costa Rica
-
 Cote d'Ivoire
-
 Croatia
-
 Cuba
-
 Cyprus
-
 Czechia
-
 DR Congo
-
 Denmark
-
 Dominican Republic
-
 Ecuador
-
 Egypt
-
 El Salvador
-
 Estonia
-
 Eswatini
-
 Ethiopia
-
 Finland
-
 France
-
 Georgia
-
 Germany
-
 Ghana
-
 Greece
-
 Haiti
-
 Hong Kong
-
 Hungary
-
 India
-
 Indonesia
-
 Iran, Islamic republic
-
 Iraq
-
 Ireland
-
 Israel
-
 Italy
-
 Jamaica
-
 Japan
-
 Jordan
-
 Kazakhstan
-
 Kenya
-
 Korea
-
 Kuwait
-
 Kyrgyzstan
-
 Laos
-
 Latvia
-
 Lebanon
-
 Lesotho
-
 Libya
-
 Lithuania
-
 Luxembourg
-
 Madagascar
-
 Malaysia
-
 Malta
-
 Mauritius
-
 Mexico
-
 Moldova
-
 Mongolia
-
 Montenegro
-
 Morocco
-
 Mozambique
-
 Myanmar
-
 Namibia
-
 Nepal
-
 Netherlands
-
 New Zealand
-
 Nigeria
-
 North Macedonia
-
 Norway
-
 Oman
-
 Pakistan
-
 Palestine
-
 Panama
-
 Papua New Guinea
-
 Paraguay
-
 Peru
-
 Philippines
-
 Poland
-
 Portugal
-
 Puerto Rico
-
 Qatar
-
 Reunion
-
 Romania
-
 Rwanda
-
 Saudi Arabia
-
 Serbia
-
 Singapore
-
 Slovakia
-
 Slovenia
-
 Somalia
-
 South Africa
-
 Spain
-
 Sri Lanka
-
 Sweden
-
 Switzerland
-
 Syria
-
 Taiwan
-
 Tajikistan
-
 Tanzania
-
 Thailand
-
 Trinidad and Tobago
-
 Tunisia
-
 Turkey
-
 UAE
-
 Uganda
-
 Ukraine
-
 United Kingdom
-
United States
-
 Uruguay
-
 Uzbekistan
-
 Venezuela
-
 Vietnam
-
 Yemen
-
 Zambia
-
 Zimbabwe
- Forex
- Crypto












