

Affirm shares technical analysis: $69.76 resistance in focus

Affirm Holdings, Inc. (AFRM) stock is trading at $69.51, climbing 3.38% on the session and holding above its longer-term trend, but still below short- and medium-term averages.
 57.53
64.30
Highlights
- Shares of Affirm Holdings declined 13.6% over the past month as elevated yields and inflation increased borrowing costs for fintech stocks.
- Affirm stock closed below its estimated GF Value, contributing to ongoing investor skepticism despite the underlying valuation gap.
- Technicals show the stock trades below key short- and medium-term moving averages with momentum indicators pointing to continued short-term weakness and a trading range of $67.03 to $71.99.
Cautious outlook intensifies as macro headwinds and valuation gap persist
Affirm Holdings has recently faced sector-specific headwinds, as September 28, 2026, saw its shares move lower amid rising yields and inflation concerns that pressured rate-sensitive fintech names, according to Finance Yahoo. These macroeconomic forces are increasing borrowing costs and dampening short-term demand for Affirm's core installment lending products, contributing to a cautious outlook among investors. Additionally, Gurufocus noted that the stock's closing price has moved below the estimated GF Value and logged a 13.6% decline over the past month, reinforcing recent skepticism despite the underlying valuation gap. Although these challenges have shaped sentiment, the market remains attentive to potential stabilization if macro pressures subside.
Bearish momentum signals intensify as intraday price volatility diverges
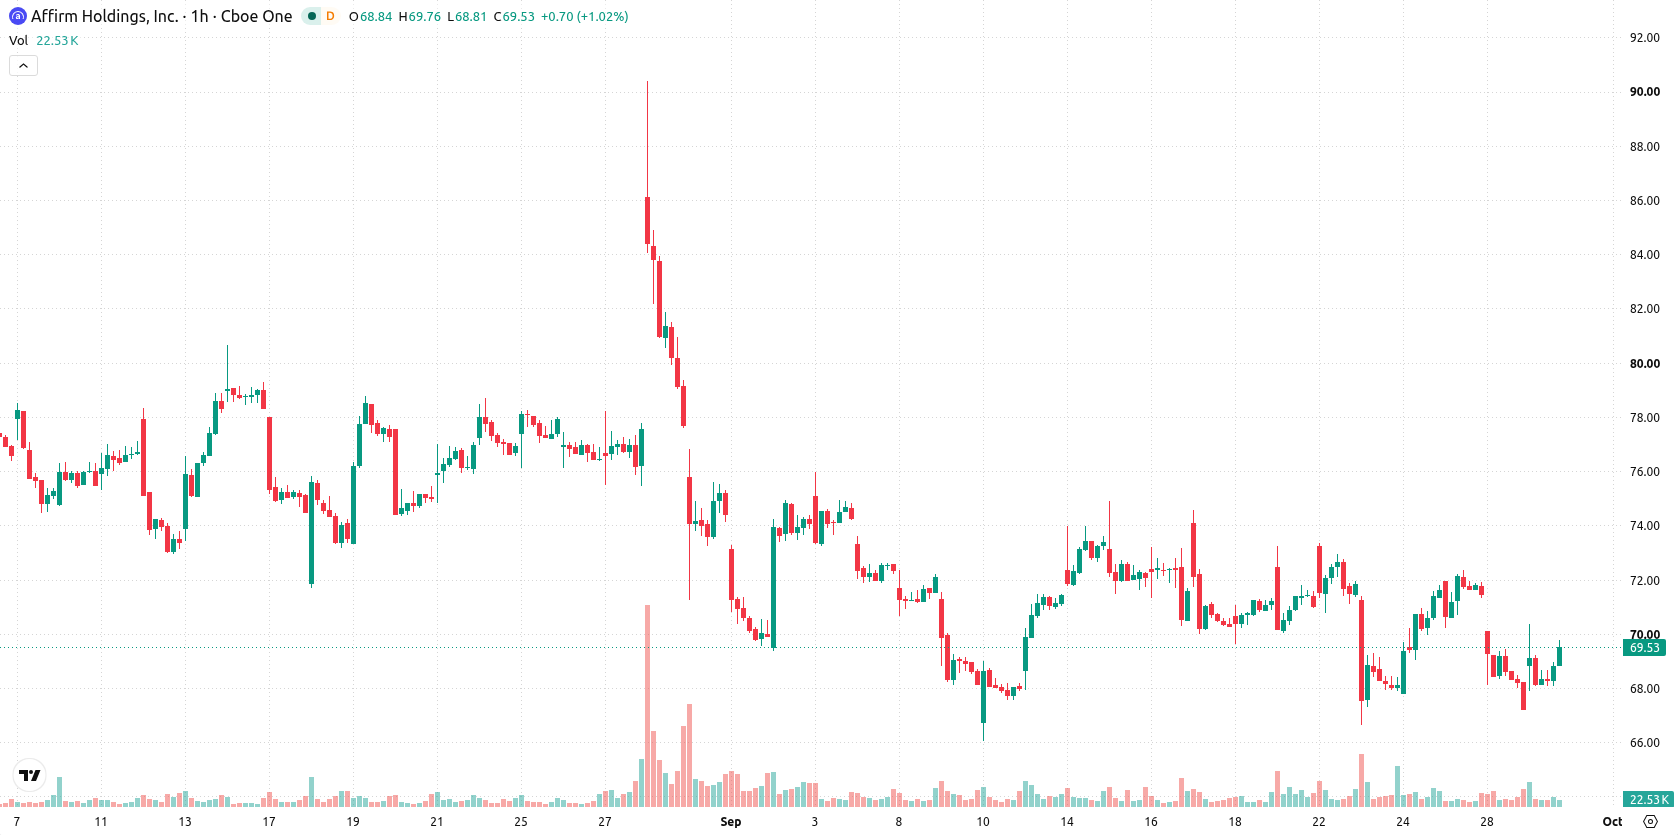
AFRM/USD is trading below both the MA-20 ($69.88) and MA-50 ($70.21) on the H1 chart, while remaining above the MA-200 ($66.75) on the daily. The Ichimoku Kijun sits at $69.76, forming immediate resistance. Short-term momentum indicators highlight a weak setup: MACD signals Sell and ADX is Neutral, while RSI, Stoch RSI, and CCI register as Sell or oversold readings. Bull/Bear Power also shows an oversold condition, underscoring seller dominance in intraday action. An upside gap of 1.6 remains, with price holding near the session high, reflecting high volatility that stands in contrast to the persistent bearish momentum from oscillators. This divergence between bullish price action and negative momentum metrics points to the possibility of near-term instability.
Bias tilts lower as volatility narrows breakout prospects
Looking ahead, AFRM/USD is expected to trade within the $67.03 to $71.99 range over the next few days, reflecting the current volatility band relative to recent levels. The probability of an upward breakout remains limited at 30%, while a downward move remains statistically more likely at 70%. The baseline scenario envisions sideways price action within this corridor. Should the price move above the immediate resistance at $69.76 and sustain, a bullish extension becomes possible; conversely, a break below support levels would open the way for further declines through the lower end of the daily range.
Earlier, analysts noted that Affirm was experiencing persistent short- and medium-term selling pressure, despite maintaining longer-term support. The current analysis adds a macroeconomic dimension to this technical outlook, highlighting that traders should watch for potential downside risk if the price fails to sustain above immediate resistance amid sector headwinds and ongoing volatility.











-
 Afghanistan
-
 Albania
-
 Algeria
-
 Angola
-
 Argentina
-
 Armenia
-
 Australia
-
 Austria
-
 Azerbaijan
-
 Bahamas
-
 Bahrain
-
 Bangladesh
-
 Belarus
-
 Belgium
-
 Bolivia
-
 Botswana
-
 Brazil
-
 Brunei
-
 Bulgaria
-
 Cambodia
-
 Cameroon
-
 Canada
-
 Chile
-
 China
-
 Colombia
-
 Congo
-
 Costa Rica
-
 Cote d'Ivoire
-
 Croatia
-
 Cuba
-
 Cyprus
-
 Czechia
-
 DR Congo
-
 Denmark
-
 Dominican Republic
-
 Ecuador
-
 Egypt
-
 El Salvador
-
 Estonia
-
 Eswatini
-
 Ethiopia
-
 Finland
-
 France
-
 Georgia
-
 Germany
-
 Ghana
-
 Greece
-
 Haiti
-
 Hong Kong
-
 Hungary
-
 India
-
 Indonesia
-
 Iran, Islamic republic
-
 Iraq
-
 Ireland
-
 Israel
-
 Italy
-
 Jamaica
-
 Japan
-
 Jordan
-
 Kazakhstan
-
 Kenya
-
 Korea
-
 Kuwait
-
 Kyrgyzstan
-
 Laos
-
 Latvia
-
 Lebanon
-
 Lesotho
-
 Libya
-
 Lithuania
-
 Luxembourg
-
 Madagascar
-
 Malaysia
-
 Malta
-
 Mauritius
-
 Mexico
-
 Moldova
-
 Mongolia
-
 Montenegro
-
 Morocco
-
 Mozambique
-
 Myanmar
-
 Namibia
-
 Nepal
-
 Netherlands
-
 New Zealand
-
 Nigeria
-
 North Macedonia
-
 Norway
-
 Oman
-
 Pakistan
-
 Palestine
-
 Panama
-
 Papua New Guinea
-
 Paraguay
-
 Peru
-
 Philippines
-
 Poland
-
 Portugal
-
 Puerto Rico
-
 Qatar
-
 Reunion
-
 Romania
-
 Rwanda
-
 Saudi Arabia
-
 Serbia
-
 Singapore
-
 Slovakia
-
 Slovenia
-
 Somalia
-
 South Africa
-
 Spain
-
 Sri Lanka
-
 Sweden
-
 Switzerland
-
 Syria
-
 Taiwan
-
 Tajikistan
-
 Tanzania
-
 Thailand
-
 Trinidad and Tobago
-
 Tunisia
-
 Turkey
-
 UAE
-
 Uganda
-
 Ukraine
-
 United Kingdom
-
United States
-
 Uruguay
-
 Uzbekistan
-
 Venezuela
-
 Vietnam
-
 Yemen
-
 Zambia
-
 Zimbabwe
- Forex
- Crypto












