

Will AstraZeneca stock hold support as Summit Therapeutics partnership expands oncology pipeline?

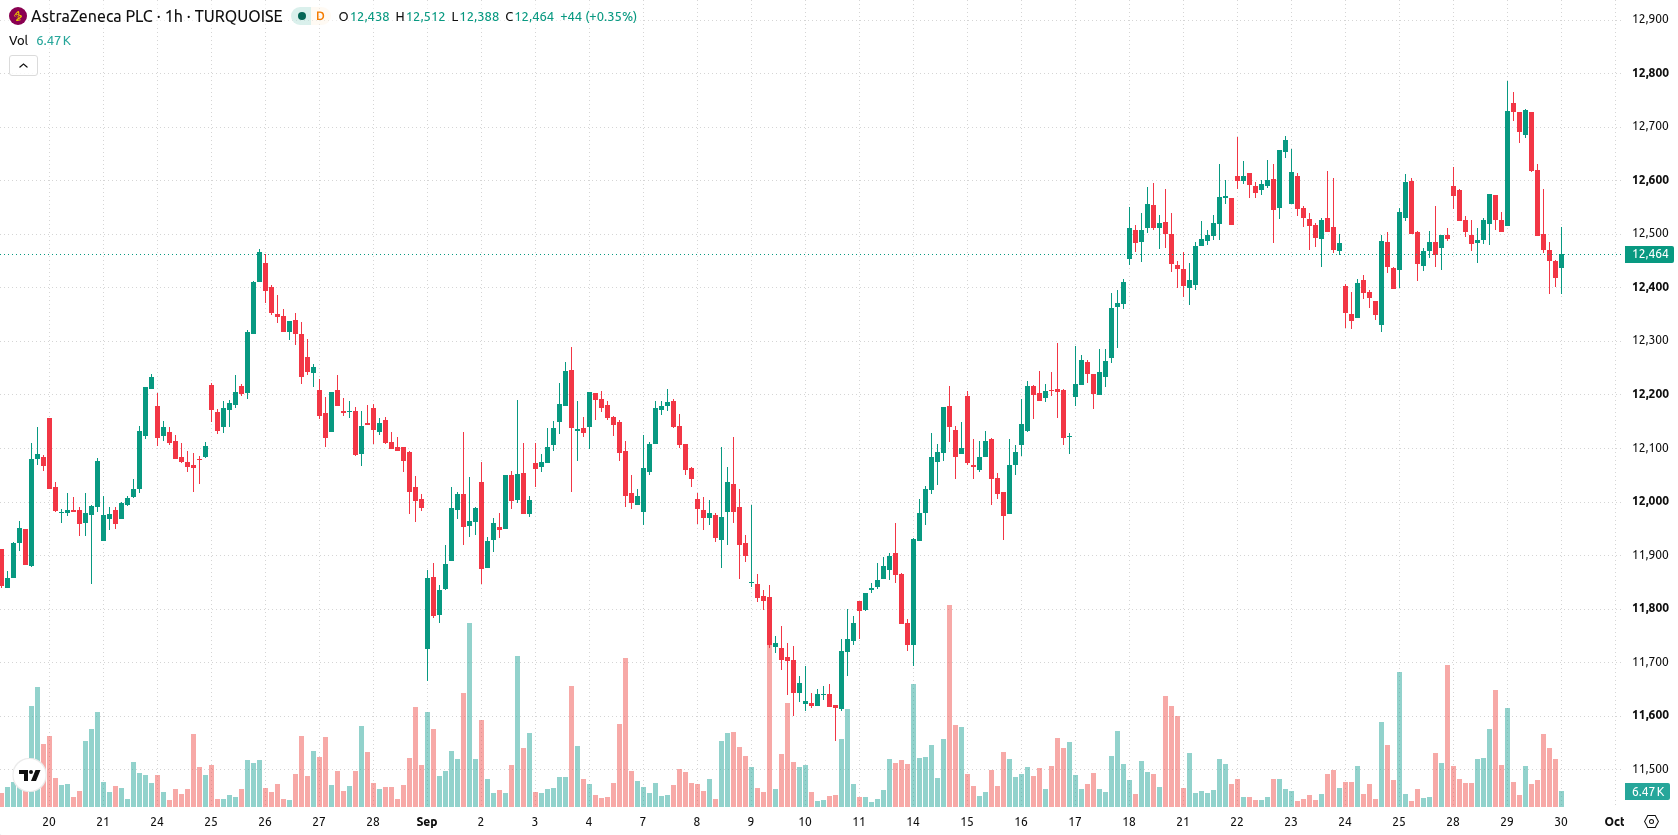
AstraZeneca (AZN) stock is trading at GBX12,422 after a modest decline for the day. The price remains below its key moving averages, signaling sustained selling interest relative to recent trends.
 14064.00
14184.00
Highlights
- AstraZeneca announced a $2 billion equity investment in Summit Therapeutics and a clinical collaboration for gastrointestinal cancer therapies.
- AstraZeneca submitted a New Drug Application to the FDA for the savolitinib and Tagrisso combination in lung cancer, potentially expanding its oncology portfolio if approved.
- Shares of AstraZeneca closed down 0.56% at GBX12,422 with technical readings showing short- and long-term bearish pressure and a projected trading range of GBX12,114 to GBX12,633.
Pipeline expansion and revenue prospects as investment targets oncology
AstraZeneca's announced $2 billion strategic equity investment in Summit Therapeutics, paired with a clinical collaboration targeting gastrointestinal cancers, marks a substantial pipeline expansion and direct capital allocation to innovation, according to Tradingview. This move not only increases its exposure to next-generation oncology therapies but may also shape future revenue growth as new treatment combinations are advanced. Additionally, AstraZeneca submitted a New Drug Application to the U.S. FDA for its combination of savolitinib and Tagrisso in lung cancer, which could create further opportunities within its oncology portfolio if approved, as reported by Gurufocus.
Mixed momentum as resistance caps rebound and sellers dominate
AZN is trading below its MA-20 at GBX12,553, MA-50 at GBX12,517, and MA-200 at GBX13,588. The Ichimoku Kijun is positioned at GBX12,587, serving as immediate resistance for any attempted rebound, while the nearest support lies near GBX12,114. Momentum indicators show a mixed technical stance: MACD remains neutral and ADX suggests a lack of strong trend. RSI at 41.62 indicates a mild sell bias, while Stochastic RSI, CCI, and Bull/Bear Power reveal oversold or seller-dominated conditions, highlighting a divergence between oscillators and underlying market momentum.
Neutral outlook as range-bound scenario shows no clear bias
Over the next 2–3 trading days, the forecast range for AZN is projected between GBX12,114 and GBX12,633, reflecting a typical volatility band relative to current levels. Both the upward and downward breakout probabilities stand at 50%, so neither direction holds a technical edge for now. The baseline scenario calls for range-bound movement, while a push above the Kijun resistance could prompt short-covering. Conversely, a break below the support may trigger a deeper retracement.
Previously it was reported that AstraZeneca shares advanced following news of its major investment in Summit Therapeutics and a pipeline expansion through oncology collaborations. In light of the current neutral technical posture and ongoing integration of strategic initiatives, traders should monitor the GBX12,587 resistance and GBX12,114 support as decisive levels for the next directional move.










-
 Afghanistan
-
 Albania
-
 Algeria
-
 Angola
-
 Argentina
-
 Armenia
-
 Australia
-
 Austria
-
 Azerbaijan
-
 Bahamas
-
 Bahrain
-
 Bangladesh
-
 Belarus
-
 Belgium
-
 Bolivia
-
 Botswana
-
 Brazil
-
 Brunei
-
 Bulgaria
-
 Cambodia
-
 Cameroon
-
 Canada
-
 Chile
-
 China
-
 Colombia
-
 Congo
-
 Costa Rica
-
 Cote d'Ivoire
-
 Croatia
-
 Cuba
-
 Cyprus
-
 Czechia
-
 DR Congo
-
 Denmark
-
 Dominican Republic
-
 Ecuador
-
 Egypt
-
 El Salvador
-
 Estonia
-
 Eswatini
-
 Ethiopia
-
 Finland
-
 France
-
 Georgia
-
 Germany
-
 Ghana
-
 Greece
-
 Haiti
-
 Hong Kong
-
 Hungary
-
 India
-
 Indonesia
-
 Iran, Islamic republic
-
 Iraq
-
 Ireland
-
 Israel
-
 Italy
-
 Jamaica
-
 Japan
-
 Jordan
-
 Kazakhstan
-
 Kenya
-
 Korea
-
 Kuwait
-
 Kyrgyzstan
-
 Laos
-
 Latvia
-
 Lebanon
-
 Lesotho
-
 Libya
-
 Lithuania
-
 Luxembourg
-
 Madagascar
-
 Malaysia
-
 Malta
-
 Mauritius
-
 Mexico
-
 Moldova
-
 Mongolia
-
 Montenegro
-
 Morocco
-
 Mozambique
-
 Myanmar
-
 Namibia
-
 Nepal
-
 Netherlands
-
 New Zealand
-
 Nigeria
-
 North Macedonia
-
 Norway
-
 Oman
-
 Pakistan
-
 Palestine
-
 Panama
-
 Papua New Guinea
-
 Paraguay
-
 Peru
-
 Philippines
-
 Poland
-
 Portugal
-
 Puerto Rico
-
 Qatar
-
 Reunion
-
 Romania
-
 Rwanda
-
 Saudi Arabia
-
 Serbia
-
 Singapore
-
 Slovakia
-
 Slovenia
-
 Somalia
-
 South Africa
-
 Spain
-
 Sri Lanka
-
 Sweden
-
 Switzerland
-
 Syria
-
 Taiwan
-
 Tajikistan
-
 Tanzania
-
 Thailand
-
 Trinidad and Tobago
-
 Tunisia
-
 Turkey
-
 UAE
-
 Uganda
-
 Ukraine
-
 United Kingdom
-
United States
-
 Uruguay
-
 Uzbekistan
-
 Venezuela
-
 Vietnam
-
 Yemen
-
 Zambia
-
 Zimbabwe
- Forex
- Crypto












