

What's behind Intuit's latest 2.5% stock surge?

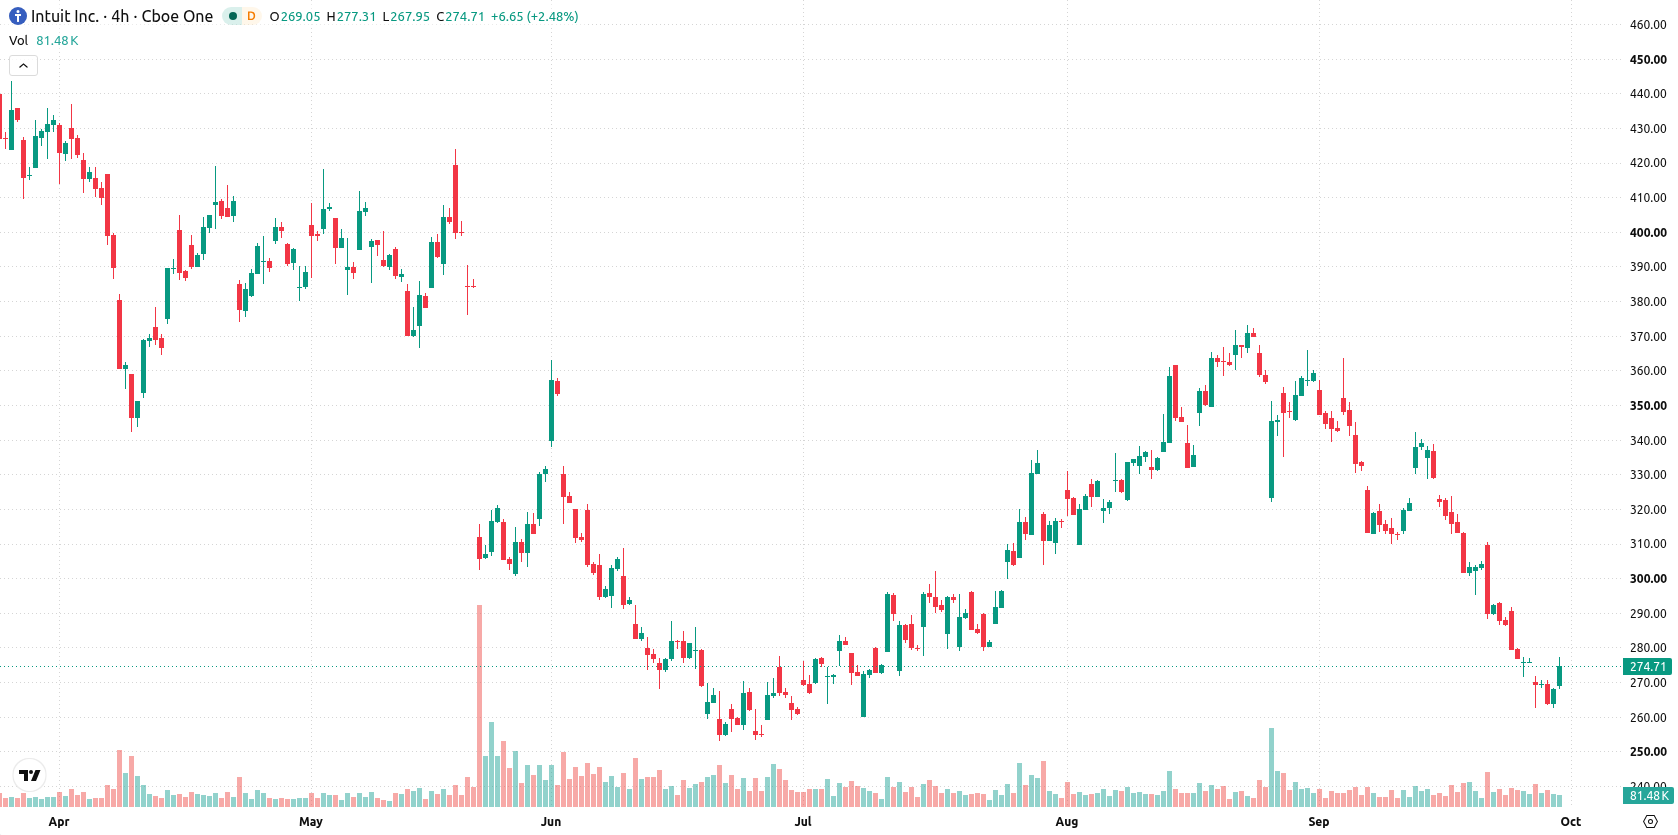
Intuit Inc. (INTU) climbed 2.48% after reporting strong fiscal fourth-quarter results, highlighting 14% revenue growth and a sharp rise in non-GAAP EPS. The rebound looks limited, with the stock still trading below all its major moving averages and oversold momentum conditions.
 344.62
366.19
Highlights
- Intuit reported fourth-quarter revenue of $4.4 billion and a 47% increase in non-GAAP diluted EPS to $4.03.
- Fiscal 2027 revenue is guided to grow 9% to 10% with expected annual revenue between $23.28 billion and $23.51 billion.
- Shares of Intuit trade below key moving averages with oversold technical signals and an expected range of $262.53 to $286.85 for the next five days.
Growth outlook boosted by new product rollouts and partnerships
Intuit reported 14% revenue growth for fiscal 2026, with fourth-quarter revenue reaching $4.4 billion and non-GAAP diluted EPS increasing 47% to $4.03. The company issued fiscal 2027 revenue guidance of 9–10% and expects annual revenue between $23.28 billion and $23.51 billion. Recent product initiatives include expanded QuickBooks integration, new AI-powered financial intelligence services in partnership with Meta, and extended agreements with the NFL, along with the launch of unified branding and additional business accelerator programs.
Extended bearish trend as oversold momentum and weak signals persist
Intuit is trading below the 20-day ($310.4), 50-day ($323.66), and 200-day ($399.5) moving averages, reinforcing sustained downside pressure for short-, medium-, and long-term trends. The nearest support and resistance levels are defined by today’s floor at $270.57 and ceiling at $277.34, with distant moving averages confirming an ongoing bearish alignment. Momentum readings are negative, with the Moving Average Convergence Divergence (MACD) issuing a Sell signal and the Average Directional Index (ADX) at 17.6 indicating weak trend strength. The Relative Strength Index (RSI) is deeply oversold at 27.46, echoed by oversold signals from Stochastic RSI, Commodity Channel Index (CCI), and Bull/Bear Power (BBP), the latter at -24.16 pointing to clear seller dominance and an oversold condition. The Awesome Oscillator (AO) also issues a Sell signal, aligning with the prevailing trend. Intraday, the stock moved up $6.66 (2.48%), opening with an upside gap of approximately $2.90 (1.08%), trading mid-range within today’s $270.57 to $277.34 span, and showing intraday volatility at 2.50%. Despite the bounce, overall intraday tone remains tentative, with sellers still dominant according to momentum and oscillator signals.
Earlier, analysts noted that Conagra's steady performance reflected ongoing demand for packaged foods despite economic headwinds. The current review of Intuit adds a contrasting perspective, as downside momentum and persistent bearish technical signals highlight ongoing downside risk with $262.53 as a key support level to monitor in the coming sessions.










-
 Afghanistan
-
 Albania
-
 Algeria
-
 Angola
-
 Argentina
-
 Armenia
-
 Australia
-
 Austria
-
 Azerbaijan
-
 Bahamas
-
 Bahrain
-
 Bangladesh
-
 Belarus
-
 Belgium
-
 Bolivia
-
 Botswana
-
 Brazil
-
 Brunei
-
 Bulgaria
-
 Cambodia
-
 Cameroon
-
 Canada
-
 Chile
-
 China
-
 Colombia
-
 Congo
-
 Costa Rica
-
 Cote d'Ivoire
-
 Croatia
-
 Cuba
-
 Cyprus
-
 Czechia
-
 DR Congo
-
 Denmark
-
 Dominican Republic
-
 Ecuador
-
 Egypt
-
 El Salvador
-
 Estonia
-
 Eswatini
-
 Ethiopia
-
 Finland
-
 France
-
 Georgia
-
 Germany
-
 Ghana
-
 Greece
-
 Haiti
-
 Hong Kong
-
 Hungary
-
 India
-
 Indonesia
-
 Iran, Islamic republic
-
 Iraq
-
 Ireland
-
 Israel
-
 Italy
-
 Jamaica
-
 Japan
-
 Jordan
-
 Kazakhstan
-
 Kenya
-
 Korea
-
 Kuwait
-
 Kyrgyzstan
-
 Laos
-
 Latvia
-
 Lebanon
-
 Lesotho
-
 Libya
-
 Lithuania
-
 Luxembourg
-
 Madagascar
-
 Malaysia
-
 Malta
-
 Mauritius
-
 Mexico
-
 Moldova
-
 Mongolia
-
 Montenegro
-
 Morocco
-
 Mozambique
-
 Myanmar
-
 Namibia
-
 Nepal
-
 Netherlands
-
 New Zealand
-
 Nigeria
-
 North Macedonia
-
 Norway
-
 Oman
-
 Pakistan
-
 Palestine
-
 Panama
-
 Papua New Guinea
-
 Paraguay
-
 Peru
-
 Philippines
-
 Poland
-
 Portugal
-
 Puerto Rico
-
 Qatar
-
 Reunion
-
 Romania
-
 Rwanda
-
 Saudi Arabia
-
 Serbia
-
 Singapore
-
 Slovakia
-
 Slovenia
-
 Somalia
-
 South Africa
-
 Spain
-
 Sri Lanka
-
 Sweden
-
 Switzerland
-
 Syria
-
 Taiwan
-
 Tajikistan
-
 Tanzania
-
 Thailand
-
 Trinidad and Tobago
-
 Tunisia
-
 Turkey
-
 UAE
-
 Uganda
-
 Ukraine
-
 United Kingdom
-
United States
-
 Uruguay
-
 Uzbekistan
-
 Venezuela
-
 Vietnam
-
 Yemen
-
 Zambia
-
 Zimbabwe
- Forex
- Crypto












