


International Business Machines Corporation (IBM) rallied 3.31% as recent coverage highlighted its status among undervalued, high-yield dividend stocks considered resilient in a rising rate environment. The advance looks limited, with IBM still trading below its 20-day, 50-day, and 200-day moving averages and the bearish technical structure intact.
 246.24
259.84
Highlights
- IBM stock is regarded as undervalued with a high dividend yield, drawing attention in current value and income strategies.
- There were no new company-specific, regulatory, or product developments for IBM reported on the target date.
- IBM trades below key moving averages with bearish momentum signals; five-day range is projected at $222.1 to $232.32.
Value positioning gains focus amid lack of new company events
IBM has been recognized in recent financial news as an undervalued stock with a high dividend yield, positioned to perform well in the context of increasing interest rates. No additional company-specific, regulatory, or product-related developments were reported for IBM on the target date. This positions the stock as a value and income candidate in current market commentary.
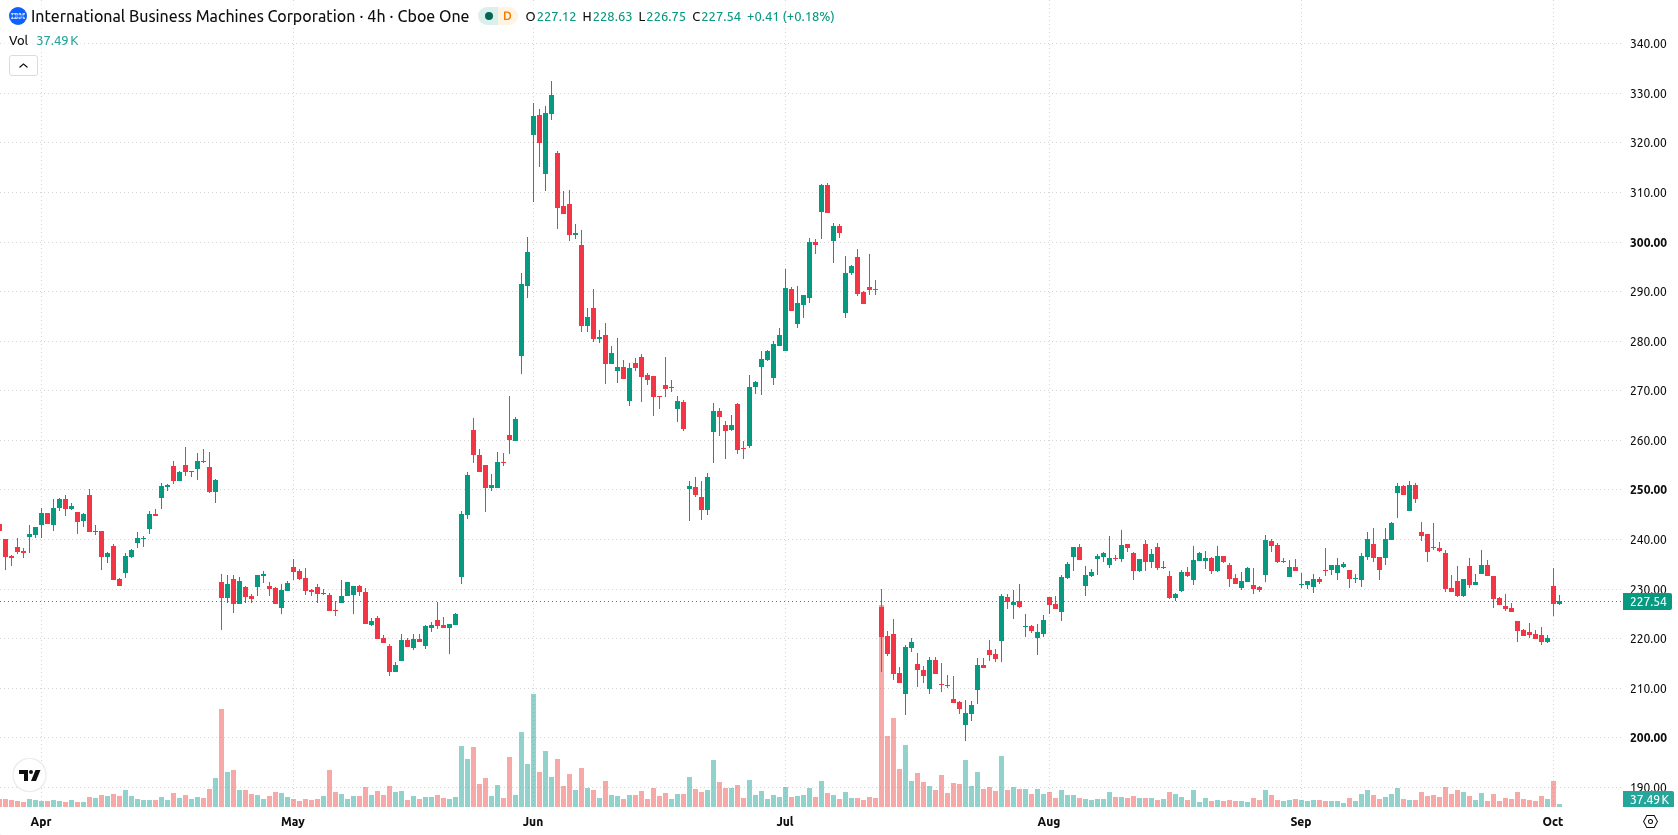
Bearish momentum dominates as oversold conditions and resistance persist
IBM is trading below its 20-day, 50-day, and 200-day moving averages at $233.11, $231.15, and $256.35 respectively, signaling sustained selling pressure across all timeframes. Near-term resistance stands at $228.81, with support established at $222.1. The overall technical structure remains bearish, given the alignment of moving averages and the Ichimoku Kijun at $235.18 acting as resistance. Momentum signals present a bearish setup, as both MACD and RSI generate sell readings. The ADX is neutral, indicating weak trend conviction. Both the Stochastic RSI and CCI point to oversold conditions. The Bull/Bear Power (BBP) at -5.89 confirms intraday seller dominance and an oversold environment. The Awesome Oscillator remains negative, reinforcing the prevailing downtrend. IBM gained $7.28 or 3.31% for the session with an upside gap of about $10.83 (4.92%), but the price is near session lows after opening at $230.76 and is drifting in the lower range of the day. Intraday volatility is 0.36%, consistent with the bearish momentum signals.
In a recent review, analysts emphasized IBM’s continued downside risk and limited breakout potential amid mixed technical signals and product developments. The latest analysis confirms this cautious outlook, with bearish momentum indicators and resistance levels reinforcing the case for close monitoring of $222.1 as the key near-term support.






Latest IBM News





-
 Afghanistan
-
 Albania
-
 Algeria
-
 Angola
-
 Argentina
-
 Armenia
-
 Australia
-
 Austria
-
 Azerbaijan
-
 Bahamas
-
 Bahrain
-
 Bangladesh
-
 Belarus
-
 Belgium
-
 Bolivia
-
 Botswana
-
 Brazil
-
 Brunei
-
 Bulgaria
-
 Cambodia
-
 Cameroon
-
 Canada
-
 Chile
-
 China
-
 Colombia
-
 Congo
-
 Costa Rica
-
 Cote d'Ivoire
-
 Croatia
-
 Cuba
-
 Cyprus
-
 Czechia
-
 DR Congo
-
 Denmark
-
 Dominican Republic
-
 Ecuador
-
 Egypt
-
 El Salvador
-
 Estonia
-
 Eswatini
-
 Ethiopia
-
 Finland
-
 France
-
 Georgia
-
 Germany
-
 Ghana
-
 Greece
-
 Haiti
-
 Hong Kong
-
 Hungary
-
 India
-
 Indonesia
-
 Iran, Islamic republic
-
 Iraq
-
 Ireland
-
 Israel
-
 Italy
-
 Jamaica
-
 Japan
-
 Jordan
-
 Kazakhstan
-
 Kenya
-
 Korea
-
 Kuwait
-
 Kyrgyzstan
-
 Laos
-
 Latvia
-
 Lebanon
-
 Lesotho
-
 Libya
-
 Lithuania
-
 Luxembourg
-
 Madagascar
-
 Malaysia
-
 Malta
-
 Mauritius
-
 Mexico
-
 Moldova
-
 Mongolia
-
 Montenegro
-
 Morocco
-
 Mozambique
-
 Myanmar
-
 Namibia
-
 Nepal
-
 Netherlands
-
 New Zealand
-
 Nigeria
-
 North Macedonia
-
 Norway
-
 Oman
-
 Pakistan
-
 Palestine
-
 Panama
-
 Papua New Guinea
-
 Paraguay
-
 Peru
-
 Philippines
-
 Poland
-
 Portugal
-
 Puerto Rico
-
 Qatar
-
 Reunion
-
 Romania
-
 Rwanda
-
 Saudi Arabia
-
 Serbia
-
 Singapore
-
 Slovakia
-
 Slovenia
-
 Somalia
-
 South Africa
-
 Spain
-
 Sri Lanka
-
 Sweden
-
 Switzerland
-
 Syria
-
 Taiwan
-
 Tajikistan
-
 Tanzania
-
 Thailand
-
 Trinidad and Tobago
-
 Tunisia
-
 Turkey
-
 UAE
-
 Uganda
-
 Ukraine
-
 United Kingdom
-
United States
-
 Uruguay
-
 Uzbekistan
-
 Venezuela
-
 Vietnam
-
 Yemen
-
 Zambia
-
 Zimbabwe
- Forex
- Crypto












