

Anthropic $11.6B AI infrastructure partnership: Can Akamai stock break $118.49 resistance?

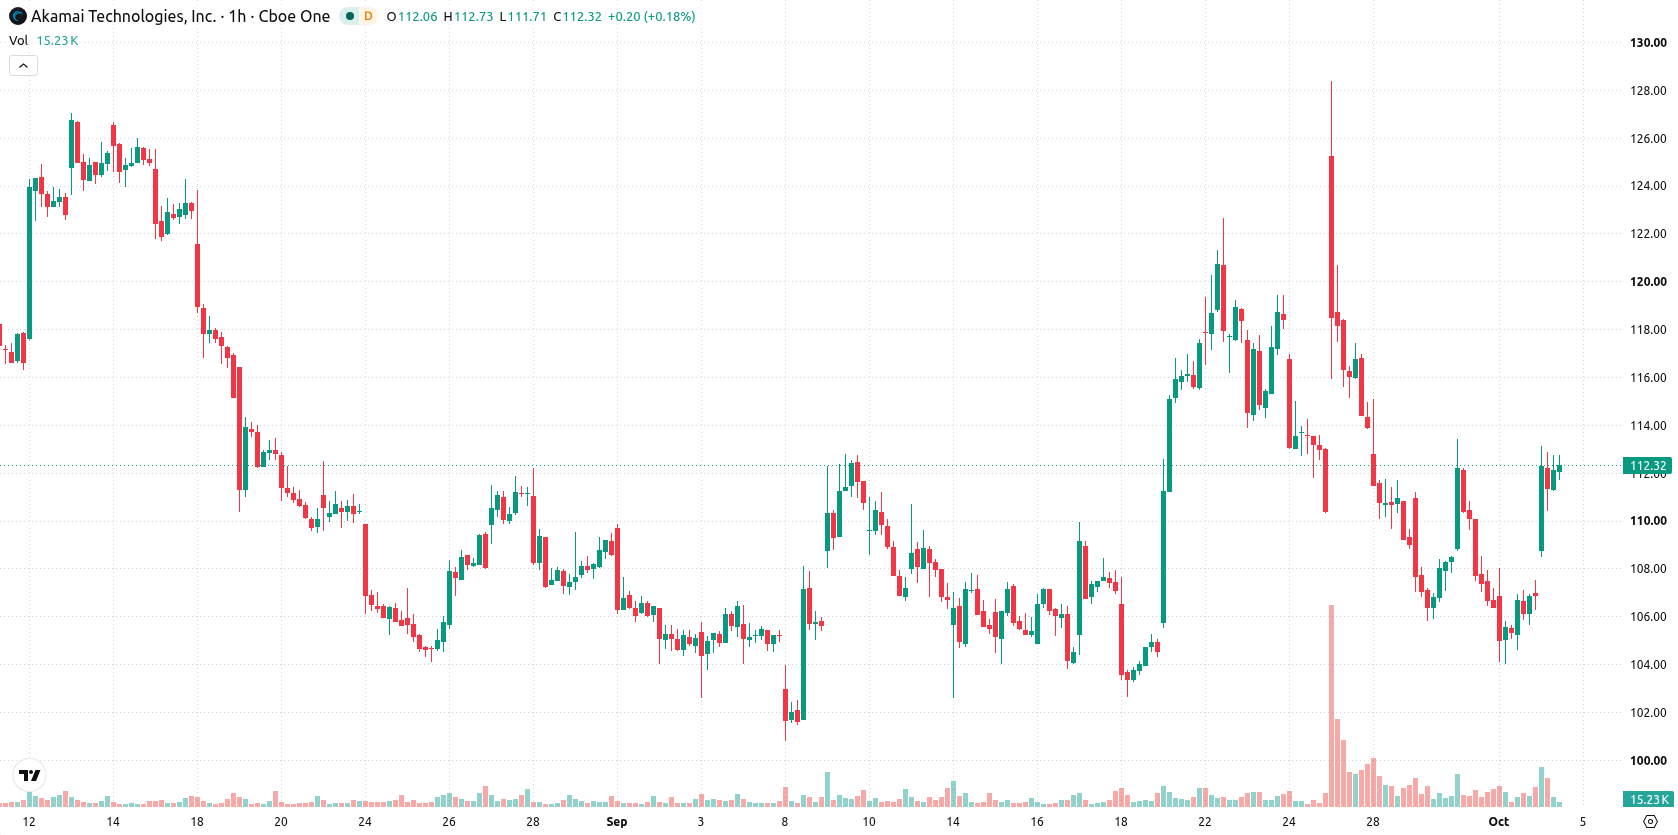
Akamai Technologies Inc (AKAM) stock is trading at $112.25 after a 4.97% jump today. The price sits above its key moving averages and has closed near the session's high, reflecting strong upward momentum on elevated volatility.
 84.88
88.51
Highlights
- Akamai secured a $11.6 billion, seven-year expansion with Anthropic, locking in significant long-term AI infrastructure revenue.
- Plans to build smaller data centers for edge AI workload processing position Akamai to capitalize on growing AI market demand.
- Akamai stock trades in a bullish structure with a projected $107.63 to $118.49 range, but technical indicators signal overbought conditions and near-term uncertainty.
AI partnership expansion boosts revenue visibility and shifts growth outlook
Akamai has secured an expanded partnership with Anthropic, involving $11.6 billion in contractual commitments over seven years, a move that locks in substantial long-term revenue and confirms robust demand for its AI infrastructure, according to CNBC. This agreement drives positive sentiment as it materially enhances the company’s projected cash flows and validates its strategic position in the fast-growing AI computation market. Akamai’s announcement to build a network of smaller data centers to process AI workloads closer to users, also reinforced by the Anthropic deal, positions the company to capture new business at the edge and further supports its growth outlook.
Technical oscillators flash mixed signals amid buyer-dominated price action
On the technical side, price action sits above the MA-20, MA-50, and MA-200 benchmarks, with the Ichimoku Kijun line at $108.72 providing immediate support. Oscillator signals are mixed: RSI is at 55.98 (Buy), while MACD indicates Strong Sell and ADX remains Neutral. CCI and Bull/Bear Power both flag overbought conditions and strong buyer dominance intraday, while Stochastic RSI and Awesome Oscillator are Neutral. This divergence between overbought momentum oscillators and a bearish MACD highlights lingering uncertainty even as buyers controlled the session.
Bullish scenario favored as volatility band guides potential breakout
Looking ahead, AKAM is expected to trade in a $107.63 to $118.49 volatility band over the next several days. Probability skews 65% toward a further upward move, with downside risk seen at 35%. The base case is for rangebound action between these recent support and resistance levels, while a close above $118.49 could trigger a sustained bullish extension. Conversely, downside scenarios may emerge should price break below the $107.63 area.
Earlier, analysts noted that Akamai’s lower valuation and strategic expansion into AI infrastructure set it apart from peers in the internet infrastructure space. The latest technical setup suggests that sustained closes above $118.49 could open the door for further upside, making this threshold a pivotal level for traders to monitor in the near term.











-
 Afghanistan
-
 Albania
-
 Algeria
-
 Angola
-
 Argentina
-
 Armenia
-
 Australia
-
 Austria
-
 Azerbaijan
-
 Bahamas
-
 Bahrain
-
 Bangladesh
-
 Belarus
-
 Belgium
-
 Bolivia
-
 Botswana
-
 Brazil
-
 Brunei
-
 Bulgaria
-
 Cambodia
-
 Cameroon
-
 Canada
-
 Chile
-
 China
-
 Colombia
-
 Congo
-
 Costa Rica
-
 Cote d'Ivoire
-
 Croatia
-
 Cuba
-
 Cyprus
-
 Czechia
-
 DR Congo
-
 Denmark
-
 Dominican Republic
-
 Ecuador
-
 Egypt
-
 El Salvador
-
 Estonia
-
 Eswatini
-
 Ethiopia
-
 Finland
-
 France
-
 Georgia
-
 Germany
-
 Ghana
-
 Greece
-
 Haiti
-
 Hong Kong
-
 Hungary
-
 India
-
 Indonesia
-
 Iran, Islamic republic
-
 Iraq
-
 Ireland
-
 Israel
-
 Italy
-
 Jamaica
-
 Japan
-
 Jordan
-
 Kazakhstan
-
 Kenya
-
 Korea
-
 Kuwait
-
 Kyrgyzstan
-
 Laos
-
 Latvia
-
 Lebanon
-
 Lesotho
-
 Libya
-
 Lithuania
-
 Luxembourg
-
 Madagascar
-
 Malaysia
-
 Malta
-
 Mauritius
-
 Mexico
-
 Moldova
-
 Mongolia
-
 Montenegro
-
 Morocco
-
 Mozambique
-
 Myanmar
-
 Namibia
-
 Nepal
-
 Netherlands
-
 New Zealand
-
 Nigeria
-
 North Macedonia
-
 Norway
-
 Oman
-
 Pakistan
-
 Palestine
-
 Panama
-
 Papua New Guinea
-
 Paraguay
-
 Peru
-
 Philippines
-
 Poland
-
 Portugal
-
 Puerto Rico
-
 Qatar
-
 Reunion
-
 Romania
-
 Rwanda
-
 Saudi Arabia
-
 Serbia
-
 Singapore
-
 Slovakia
-
 Slovenia
-
 Somalia
-
 South Africa
-
 Spain
-
 Sri Lanka
-
 Sweden
-
 Switzerland
-
 Syria
-
 Taiwan
-
 Tajikistan
-
 Tanzania
-
 Thailand
-
 Trinidad and Tobago
-
 Tunisia
-
 Turkey
-
 UAE
-
 Uganda
-
 Ukraine
-
 United Kingdom
-
United States
-
 Uruguay
-
 Uzbekistan
-
 Venezuela
-
 Vietnam
-
 Yemen
-
 Zambia
-
 Zimbabwe
- Forex
- Crypto












