

Kirby stock rises nearly 4% as bullish momentum and buying pressure push price higher

Kirby Corporation (KEX) climbed 3.63% on the day as bullish momentum and recent buying pressure drove the price upward. The move appears limited by weak trend strength and signs of downside bias from key oscillators, even with the price trading above all major moving averages.
 129.84
Highlights
- Shares of Kirby are trading above major moving averages, confirming a bullish structure across all timeframes.
- Momentum indicators are mixed, with most short-term signals leaning bearish despite strong intraday price action.
- The projected 5-day range is $134.81 to $141.8, with technicals pointing to a 67% probability of a downward move.
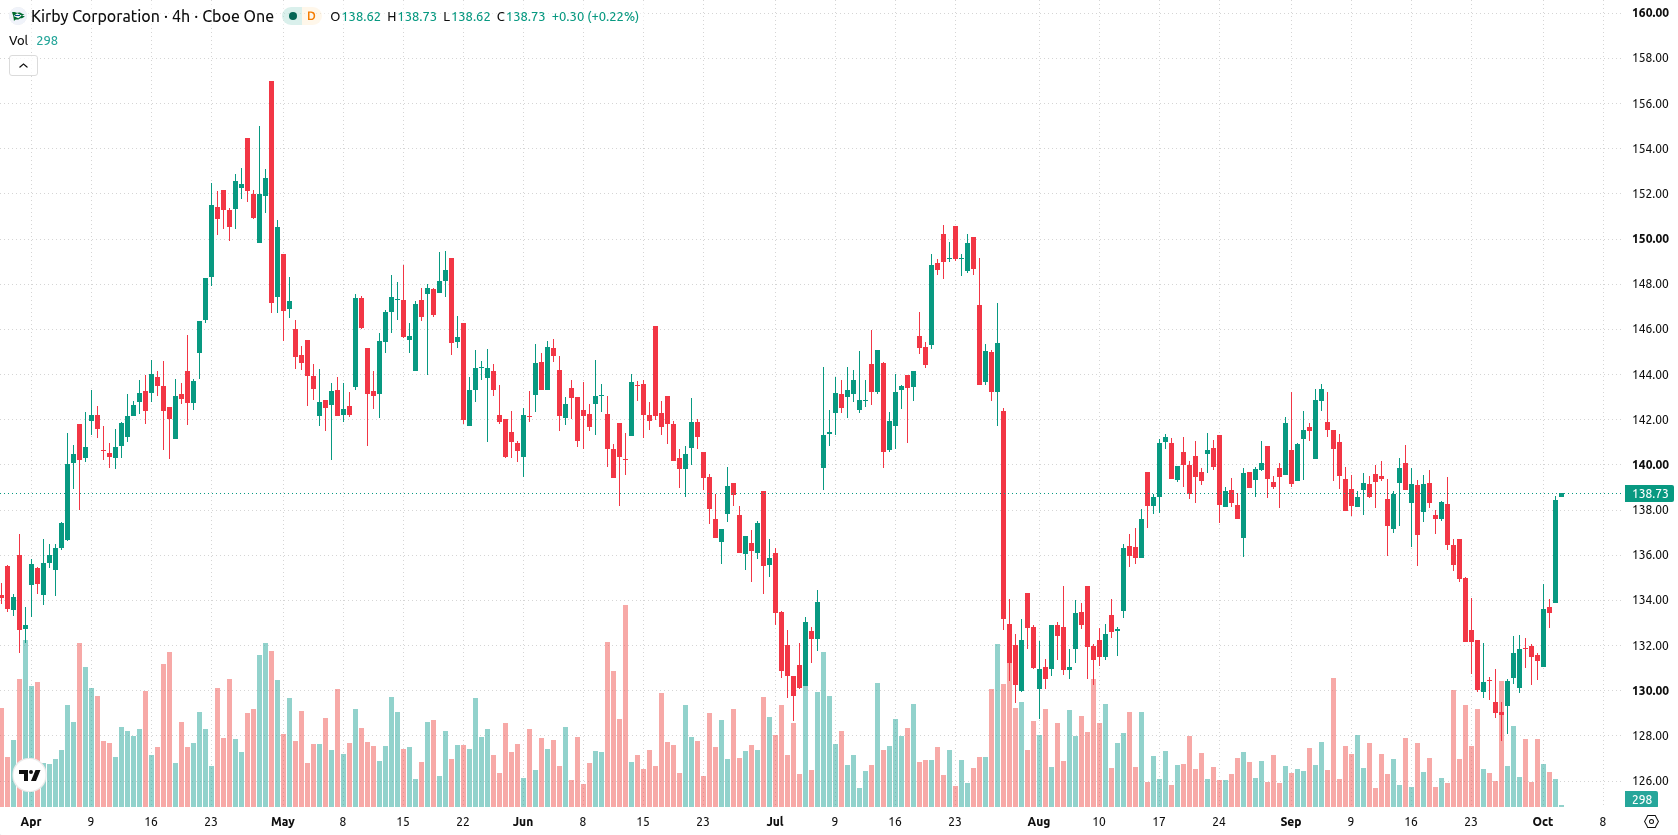
Bullish structure persists as momentum signals send mixed warnings
Kirby is trading above all major moving averages, with the price at $138.3, well above the MA-20 ($135.77), MA-50 ($137.02), and MA-200 ($134.46). This alignment confirms a bullish structure across short-, medium-, and long-term trends, with the near-term resistance at $141.8 and support at $137.35. Momentum readings are mixed. The Moving Average Convergence Divergence (MACD) signals selling pressure, and the Average Directional Index (ADX) at 14.62 suggests a weak trend. The Relative Strength Index (RSI) falls to 44.99, projecting a "Sell" signal that hints at mild downside bias, while the Stochastic RSI is neutral at 76.97 and the Commodity Channel Index (CCI) also points to selling. Bull/Bear Power (BBP) stands at 1.12, showing buyers currently dominate intraday momentum, but the indicator is flashing overbought conditions. The stock is up $4.84 or 3.63% on the day following an upside gap of $0.45 (0.34%). Price is trading near the high of today’s $131.8–$137.35 range and intraday volatility stands at 4.21%. Momentum is conflicted, with intraday action showing strength despite underlying short-term indicators leaning bearish.
Earlier, analysts noted heightened downside risk for Kirby shares amid persistent technical weakness and lackluster momentum indicators. The current setup adds a new dimension by showing that, despite a 3.63% advance and bullish trend structure, prevailing downside signals warrant close attention to the $137.35 support as a key level for near-term direction.






Latest Kirby Corporation News



-
 Afghanistan
-
 Albania
-
 Algeria
-
 Angola
-
 Argentina
-
 Armenia
-
 Australia
-
 Austria
-
 Azerbaijan
-
 Bahamas
-
 Bahrain
-
 Bangladesh
-
 Belarus
-
 Belgium
-
 Bolivia
-
 Botswana
-
 Brazil
-
 Brunei
-
 Bulgaria
-
 Cambodia
-
 Cameroon
-
 Canada
-
 Chile
-
 China
-
 Colombia
-
 Congo
-
 Costa Rica
-
 Cote d'Ivoire
-
 Croatia
-
 Cuba
-
 Cyprus
-
 Czechia
-
 DR Congo
-
 Denmark
-
 Dominican Republic
-
 Ecuador
-
 Egypt
-
 El Salvador
-
 Estonia
-
 Eswatini
-
 Ethiopia
-
 Finland
-
 France
-
 Georgia
-
 Germany
-
 Ghana
-
 Greece
-
 Haiti
-
 Hong Kong
-
 Hungary
-
 India
-
 Indonesia
-
 Iran, Islamic republic
-
 Iraq
-
 Ireland
-
 Israel
-
 Italy
-
 Jamaica
-
 Japan
-
 Jordan
-
 Kazakhstan
-
 Kenya
-
 Korea
-
 Kuwait
-
 Kyrgyzstan
-
 Laos
-
 Latvia
-
 Lebanon
-
 Lesotho
-
 Libya
-
 Lithuania
-
 Luxembourg
-
 Madagascar
-
 Malaysia
-
 Malta
-
 Mauritius
-
 Mexico
-
 Moldova
-
 Mongolia
-
 Montenegro
-
 Morocco
-
 Mozambique
-
 Myanmar
-
 Namibia
-
 Nepal
-
 Netherlands
-
 New Zealand
-
 Nigeria
-
 North Macedonia
-
 Norway
-
 Oman
-
 Pakistan
-
 Palestine
-
 Panama
-
 Papua New Guinea
-
 Paraguay
-
 Peru
-
 Philippines
-
 Poland
-
 Portugal
-
 Puerto Rico
-
 Qatar
-
 Reunion
-
 Romania
-
 Rwanda
-
 Saudi Arabia
-
 Serbia
-
 Singapore
-
 Slovakia
-
 Slovenia
-
 Somalia
-
 South Africa
-
 Spain
-
 Sri Lanka
-
 Sweden
-
 Switzerland
-
 Syria
-
 Taiwan
-
 Tajikistan
-
 Tanzania
-
 Thailand
-
 Trinidad and Tobago
-
 Tunisia
-
 Turkey
-
 UAE
-
 Uganda
-
 Ukraine
-
 United Kingdom
-
United States
-
 Uruguay
-
 Uzbekistan
-
 Venezuela
-
 Vietnam
-
 Yemen
-
 Zambia
-
 Zimbabwe
- Forex
- Crypto












