

Will Canadian Natural Resources stock avoid deeper losses as Pathways CCS project MOU advances?

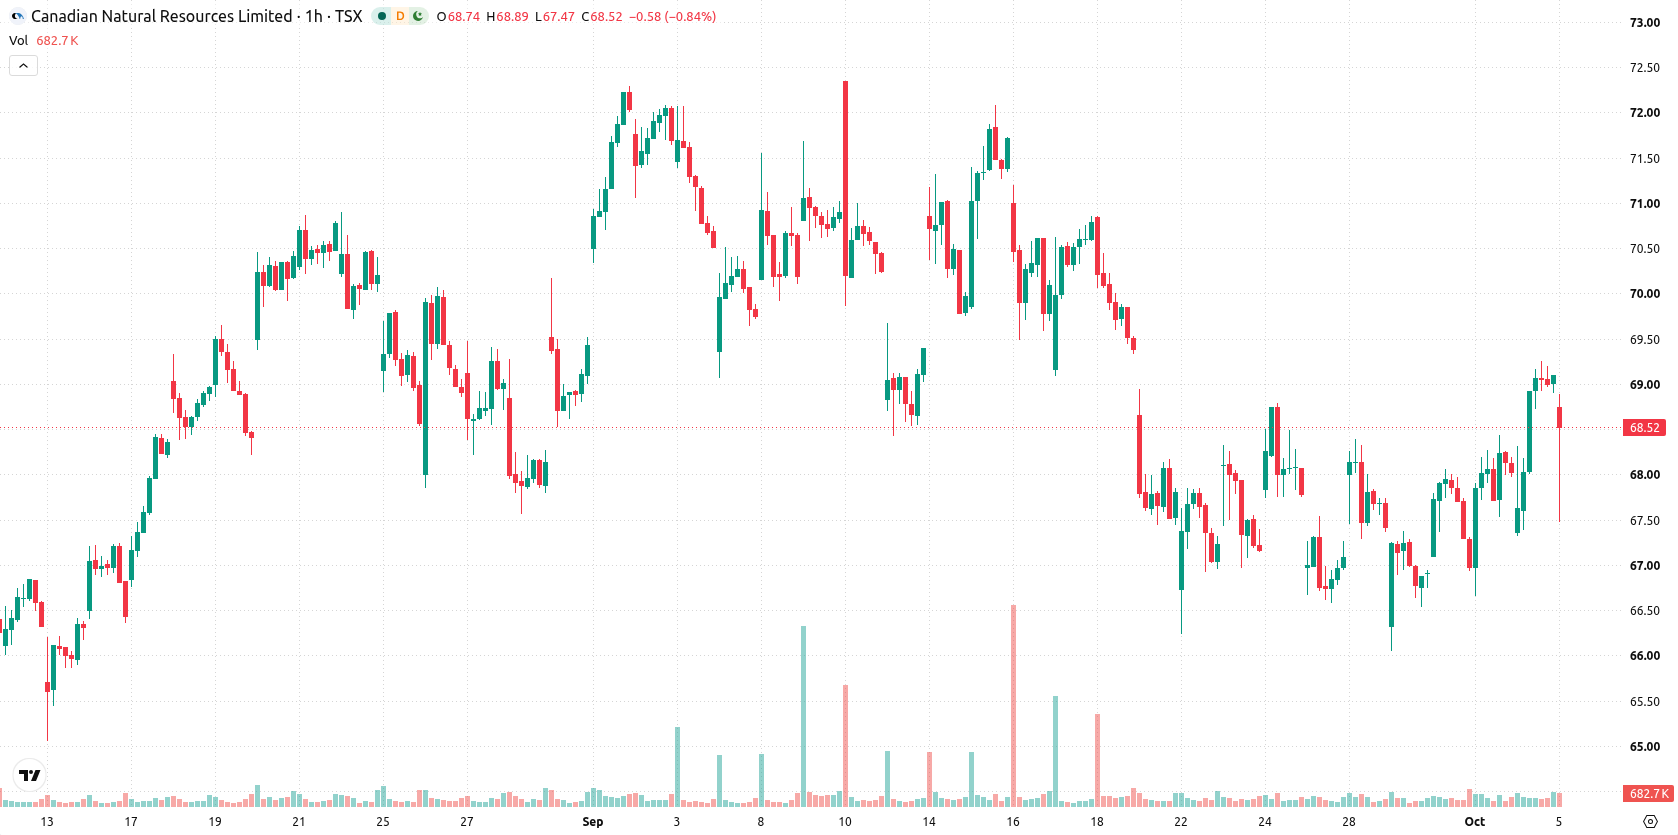
Canadian Natural Resources (CNQ) stock is trading at C$68.58, slipping modestly on the day. The price remains above its key moving averages.
 69.79
70.98
Highlights
- Canadian Natural Resources and peers signed a memorandum of understanding with federal and Alberta governments targeting capture of up to 16 million tonnes of CO2 annually by 2045.
- Final binding terms for the Pathways CCS project partnership remain pending, limiting immediate effects to expectations for future regulatory and project developments.
- CNQ shares remain in a bullish technical setup above key moving averages, but conflicting short-term momentum signals and a 45% up probability suggest likely consolidation in a C$67.18 to C$69.98 range.
Emissions pact advances as regulatory details slow impact
In late September 2026, Canadian Natural Resources and several peer oil sands producers entered into a trilateral memorandum of understanding with both the federal and Alberta governments to move the Pathways CCS (carbon capture and storage) project forward, according to Finance Yahoo. The agreement sets a goal to capture up to 16 million tonnes of CO2 annually by 2045, though final binding terms for the partnership remain pending. This corporate commitment aligns key industry and government participants on long-term emissions reduction objectives, but with critical details outstanding, immediate impacts are limited to expectations around future regulatory and project milestones.
Mixed momentum and overbought signals as multi-period support holds
On the technical front, CNQ is trading above the MA-20 at C$68.17, MA-50 at C$67.77, and the long-term MA-200 at C$60.92 on the hourly chart, indicating multi-period support with the Ichimoku Kijun level at C$67.9 as immediate technical backing. Intraday signals are mixed: MACD shows a Buy while ADX reads as Neutral, suggesting trend momentum is present but not strongly established. RSI, CCI, and Bull/Bear Power all indicate buying pressure, yet Stochastic RSI registers a Strong Sell, flagging that recent gains may be overextended. The Awesome Oscillator corroborates the current upward bias despite these divergences.
Consolidation risk rises as downside bias emerges short term
Over the next several sessions, CNQ is likely to consolidate between C$67.18 and C$69.98, with a slightly higher probability of a downward move in the immediate term. The baseline scenario anticipates continued trading within this volatility band. A close above C$69.98 could trigger renewed bullish momentum, while a drop below C$67.18 would open the door to additional downside risk.
Previously it was reported that Canadian Natural Resources continued to show fundamental support and operational strength, with analysts anticipating mostly sideways trading and modest downside risk. The current alignment with government-led carbon capture initiatives, alongside mixed but generally supportive technical indicators, suggests traders should closely monitor whether the price can decisively exit its present consolidation range for signals of the next trend direction.










-
 Afghanistan
-
 Albania
-
 Algeria
-
 Angola
-
 Argentina
-
 Armenia
-
 Australia
-
 Austria
-
 Azerbaijan
-
 Bahamas
-
 Bahrain
-
 Bangladesh
-
 Belarus
-
 Belgium
-
 Bolivia
-
 Botswana
-
 Brazil
-
 Brunei
-
 Bulgaria
-
 Cambodia
-
 Cameroon
-
 Canada
-
 Chile
-
 China
-
 Colombia
-
 Congo
-
 Costa Rica
-
 Cote d'Ivoire
-
 Croatia
-
 Cuba
-
 Cyprus
-
 Czechia
-
 DR Congo
-
 Denmark
-
 Dominican Republic
-
 Ecuador
-
 Egypt
-
 El Salvador
-
 Estonia
-
 Eswatini
-
 Ethiopia
-
 Finland
-
 France
-
 Georgia
-
 Germany
-
 Ghana
-
 Greece
-
 Haiti
-
 Hong Kong
-
 Hungary
-
 India
-
 Indonesia
-
 Iran, Islamic republic
-
 Iraq
-
 Ireland
-
 Israel
-
 Italy
-
 Jamaica
-
 Japan
-
 Jordan
-
 Kazakhstan
-
 Kenya
-
 Korea
-
 Kuwait
-
 Kyrgyzstan
-
 Laos
-
 Latvia
-
 Lebanon
-
 Lesotho
-
 Libya
-
 Lithuania
-
 Luxembourg
-
 Madagascar
-
 Malaysia
-
 Malta
-
 Mauritius
-
 Mexico
-
 Moldova
-
 Mongolia
-
 Montenegro
-
 Morocco
-
 Mozambique
-
 Myanmar
-
 Namibia
-
 Nepal
-
 Netherlands
-
 New Zealand
-
 Nigeria
-
 North Macedonia
-
 Norway
-
 Oman
-
 Pakistan
-
 Palestine
-
 Panama
-
 Papua New Guinea
-
 Paraguay
-
 Peru
-
 Philippines
-
 Poland
-
 Portugal
-
 Puerto Rico
-
 Qatar
-
 Reunion
-
 Romania
-
 Rwanda
-
 Saudi Arabia
-
 Serbia
-
 Singapore
-
 Slovakia
-
 Slovenia
-
 Somalia
-
 South Africa
-
 Spain
-
 Sri Lanka
-
 Sweden
-
 Switzerland
-
 Syria
-
 Taiwan
-
 Tajikistan
-
 Tanzania
-
 Thailand
-
 Trinidad and Tobago
-
 Tunisia
-
 Turkey
-
 UAE
-
 Uganda
-
 Ukraine
-
 United Kingdom
-
United States
-
 Uruguay
-
 Uzbekistan
-
 Venezuela
-
 Vietnam
-
 Yemen
-
 Zambia
-
 Zimbabwe
- Forex
- Crypto












