


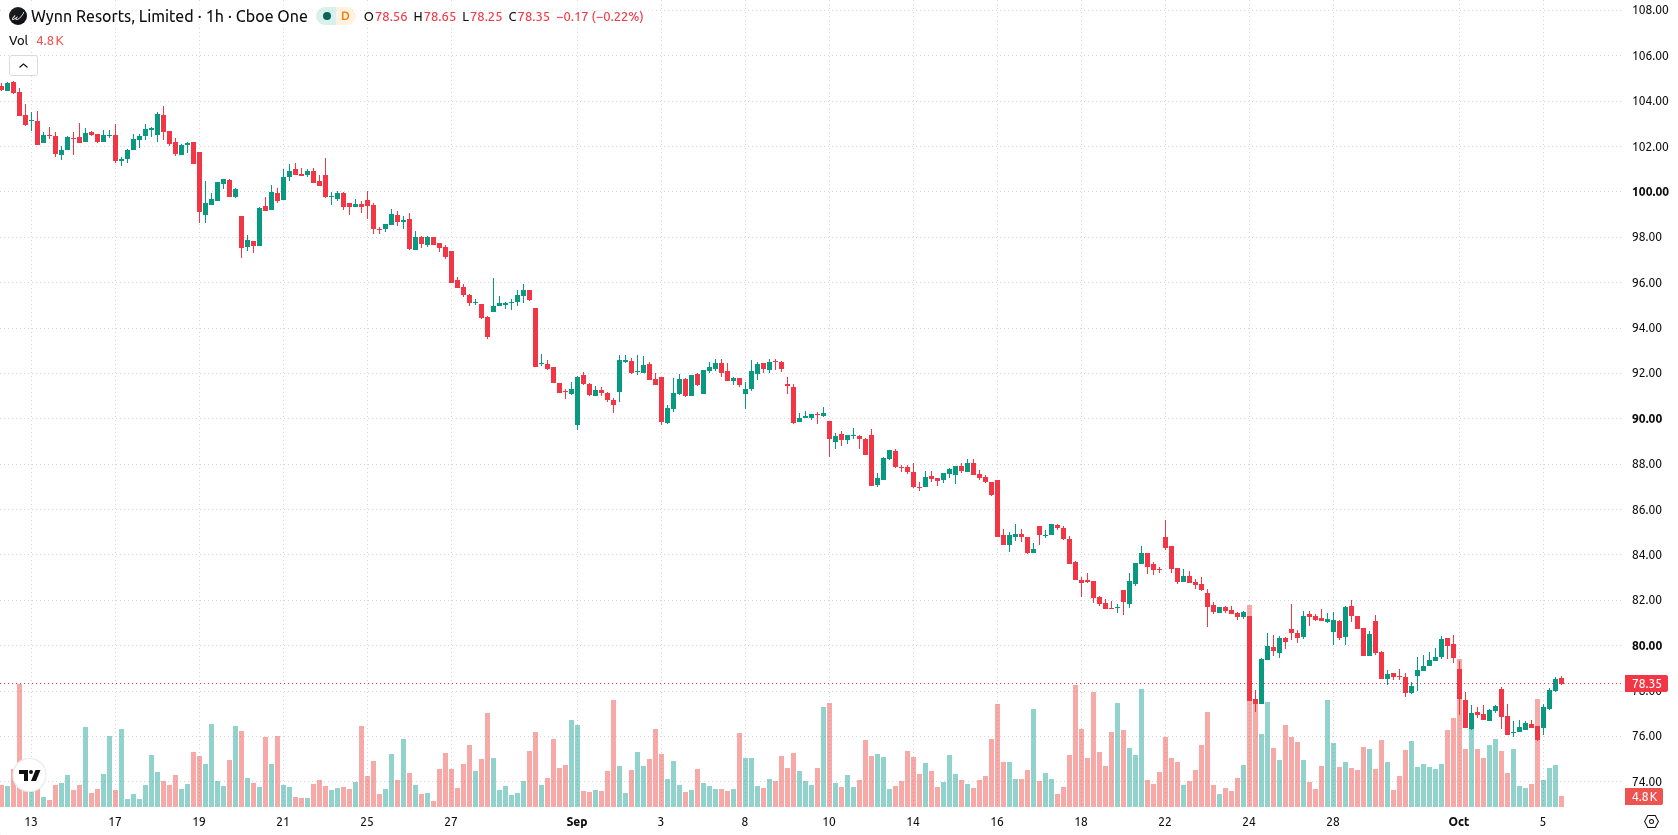
Wynn Resorts (WYNN) stock is trading at $78.55, marking a daily gain of 3.53%. The price sits above its key short-term moving average but remains beneath the main mid- and long-term averages.
 84.43
87.43
Highlights
- WYNN/USD trades above short-term moving averages but remains below medium- and long-term levels, signaling overall bearish pressure.
- Momentum indicators show strong downside risk with mixed oscillator readings, indicating trend direction remains uncertain.
- Price is expected to move between $76.21 and $80.89 over the next 2 to 3 days, with 55% probability of further downside.
Divergent momentum as technicals flag overextension and mixed signals
On the technical front, WYNN is trading above the MA-20 yet remains below the MA-50 on the hourly chart and significantly beneath the MA-200 on the daily timeframe. The Ichimoku Kijun level at $78.1 acts as immediate support. MACD signals strong downside momentum, while ADX is neutral, reflecting uncertainty in trend strength. RSI reads 46.55, pointing to mild selling bias. Both Stochastic RSI and Bull/Bear Power indicate overbought conditions. CCI and Awesome Oscillator remain neutral, highlighting a mixed technical environment with evidence of momentum divergence and possible short-term overextension.
Marginal bearish bias as downside risk outweighs upside near-term
For the coming 2 to 3 trading days, WYNN is projected to trade between $76.21 and $80.89. The probability of additional gains is about 45%, with a 55% likelihood of a decline, favoring a marginally bearish short-term scenario. The base case calls for sideways consolidation inside this volatility band, but a decisive move above resistance could prompt a bullish turn, while a drop below support would confirm renewed selling pressure.
Earlier, analysts noted that Wynn Resorts faced sustained headwinds and heightened downside risks amid declining Macau gaming revenues and ongoing technical weakness. The latest technical signals confirm a still-cautious outlook, making a decisive move above current resistance or a break below support critical cues for traders monitoring near-term volatility.






Latest Wynn Resorts Limited News





-
 Afghanistan
-
 Albania
-
 Algeria
-
 Angola
-
 Argentina
-
 Armenia
-
 Australia
-
 Austria
-
 Azerbaijan
-
 Bahamas
-
 Bahrain
-
 Bangladesh
-
 Belarus
-
 Belgium
-
 Bolivia
-
 Botswana
-
 Brazil
-
 Brunei
-
 Bulgaria
-
 Cambodia
-
 Cameroon
-
 Canada
-
 Chile
-
 China
-
 Colombia
-
 Congo
-
 Costa Rica
-
 Cote d'Ivoire
-
 Croatia
-
 Cuba
-
 Cyprus
-
 Czechia
-
 DR Congo
-
 Denmark
-
 Dominican Republic
-
 Ecuador
-
 Egypt
-
 El Salvador
-
 Estonia
-
 Eswatini
-
 Ethiopia
-
 Finland
-
 France
-
 Georgia
-
 Germany
-
 Ghana
-
 Greece
-
 Haiti
-
 Hong Kong
-
 Hungary
-
 India
-
 Indonesia
-
 Iran, Islamic republic
-
 Iraq
-
 Ireland
-
 Israel
-
 Italy
-
 Jamaica
-
 Japan
-
 Jordan
-
 Kazakhstan
-
 Kenya
-
 Korea
-
 Kuwait
-
 Kyrgyzstan
-
 Laos
-
 Latvia
-
 Lebanon
-
 Lesotho
-
 Libya
-
 Lithuania
-
 Luxembourg
-
 Madagascar
-
 Malaysia
-
 Malta
-
 Mauritius
-
 Mexico
-
 Moldova
-
 Mongolia
-
 Montenegro
-
 Morocco
-
 Mozambique
-
 Myanmar
-
 Namibia
-
 Nepal
-
 Netherlands
-
 New Zealand
-
 Nigeria
-
 North Macedonia
-
 Norway
-
 Oman
-
 Pakistan
-
 Palestine
-
 Panama
-
 Papua New Guinea
-
 Paraguay
-
 Peru
-
 Philippines
-
 Poland
-
 Portugal
-
 Puerto Rico
-
 Qatar
-
 Reunion
-
 Romania
-
 Rwanda
-
 Saudi Arabia
-
 Serbia
-
 Singapore
-
 Slovakia
-
 Slovenia
-
 Somalia
-
 South Africa
-
 Spain
-
 Sri Lanka
-
 Sweden
-
 Switzerland
-
 Syria
-
 Taiwan
-
 Tajikistan
-
 Tanzania
-
 Thailand
-
 Trinidad and Tobago
-
 Tunisia
-
 Turkey
-
 UAE
-
 Uganda
-
 Ukraine
-
 United Kingdom
-
United States
-
 Uruguay
-
 Uzbekistan
-
 Venezuela
-
 Vietnam
-
 Yemen
-
 Zambia
-
 Zimbabwe
- Forex
- Crypto












