

IBM shares weekly forecast: Oversold CCI shapes near-term range between support and resistance

Shares of International Business Machines Corporation (IBM) are trading near $223 as support comes into focus after a stretched decline. Trading was quiet last week, with attention fixed on how quickly buyers might step in heading into IBM’s next key earnings event. The week ahead will likely see market participants watching for catalysts to break the range or reinforce support.
 248.20
258.48
Highlights
- Shares of IBM have edged up $0.21 in the past week to $222.83 but remain below key moving averages.
- The stock is consolidating in a narrow range, with bearish momentum signals and volatility at 6.91%.
- Expected trading range for the coming week is $216.07 to $229.58, with higher probability of further downside if support at $218.64 breaks.
Earnings optimism builds as sector strength and growth forecasts drive sentiment
IBM shares rose modestly last week after Accenture reported stronger-than-expected consulting earnings, suggesting some positive sentiment in the sector ahead of IBM's own upcoming third-quarter financial report, according to coverage from CoinCentral, MoneyCheck, and The Motley Fool. Investor attention remains focused on the company's revenue growth outlook and its approximately 3% dividend yield. Management continues to project around 5% revenue growth for 2026.
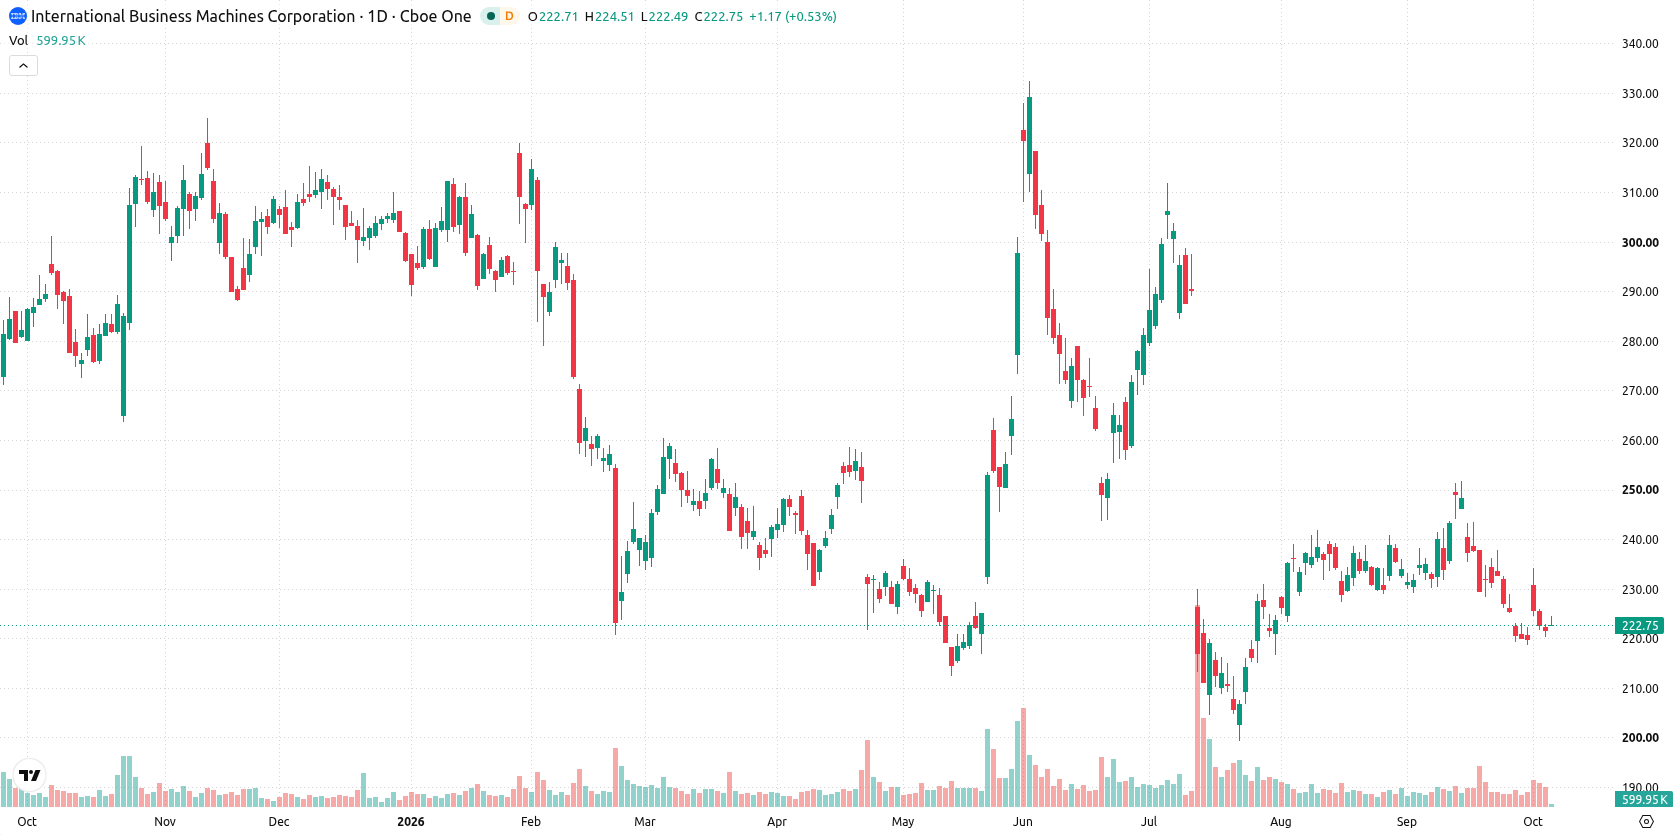
Bearish momentum persists as IBM consolidates below resistance levels this week
On the daily chart, IBM stock is entrenched in a contained move within a narrow range, with volatility at 6.91% despite a flat trend. Momentum signals are predominantly bearish, with the MACD in sell territory and the CCI firmly oversold at -105.64. The nearest support sits at $218.64, while resistance is seen at the 20-day moving average of $231.51, with the Ichimoku Kijun at $235.2 acting as another barrier above. Price action now reflects consolidation below resistance, suggesting further weakness unless buyers regain control.
Downside bias remains as risks tilt toward support breach in coming week
For the coming trading week, the expected range is $216.07 to $229.58, with a very high probability of a decrease and very low probability of an increase. The base case sees IBM shares consolidating between the support at $218.64 and resistance at $231.51. A bullish scenario would require a move above $231.51, opening the door to test higher levels. A bearish scenario unfolds on a breakdown below $218.64, likely extending losses toward the lower end of the forecast range.
Earlier, analysts noted that IBM entered a more volatile phase as technical levels became increasingly pivotal ahead of earnings, with enterprise and quantum initiatives providing some longer-term support. With shares now consolidating just above support following a muted week, traders should watch for any decisive break of $218.64 or a move above $231.51 to set the next direction.






Latest IBM News





-
 Afghanistan
-
 Albania
-
 Algeria
-
 Angola
-
 Argentina
-
 Armenia
-
 Australia
-
 Austria
-
 Azerbaijan
-
 Bahamas
-
 Bahrain
-
 Bangladesh
-
 Belarus
-
 Belgium
-
 Bolivia
-
 Botswana
-
 Brazil
-
 Brunei
-
 Bulgaria
-
 Cambodia
-
 Cameroon
-
 Canada
-
 Chile
-
 China
-
 Colombia
-
 Congo
-
 Costa Rica
-
 Cote d'Ivoire
-
 Croatia
-
 Cuba
-
 Cyprus
-
 Czechia
-
 DR Congo
-
 Denmark
-
 Dominican Republic
-
 Ecuador
-
 Egypt
-
 El Salvador
-
 Estonia
-
 Eswatini
-
 Ethiopia
-
 Finland
-
 France
-
 Georgia
-
 Germany
-
 Ghana
-
 Greece
-
 Haiti
-
 Hong Kong
-
 Hungary
-
 India
-
 Indonesia
-
 Iran, Islamic republic
-
 Iraq
-
 Ireland
-
 Israel
-
 Italy
-
 Jamaica
-
 Japan
-
 Jordan
-
 Kazakhstan
-
 Kenya
-
 Korea
-
 Kuwait
-
 Kyrgyzstan
-
 Laos
-
 Latvia
-
 Lebanon
-
 Lesotho
-
 Libya
-
 Lithuania
-
 Luxembourg
-
 Madagascar
-
 Malaysia
-
 Malta
-
 Mauritius
-
 Mexico
-
 Moldova
-
 Mongolia
-
 Montenegro
-
 Morocco
-
 Mozambique
-
 Myanmar
-
 Namibia
-
 Nepal
-
 Netherlands
-
 New Zealand
-
 Nigeria
-
 North Macedonia
-
 Norway
-
 Oman
-
 Pakistan
-
 Palestine
-
 Panama
-
 Papua New Guinea
-
 Paraguay
-
 Peru
-
 Philippines
-
 Poland
-
 Portugal
-
 Puerto Rico
-
 Qatar
-
 Reunion
-
 Romania
-
 Rwanda
-
 Saudi Arabia
-
 Serbia
-
 Singapore
-
 Slovakia
-
 Slovenia
-
 Somalia
-
 South Africa
-
 Spain
-
 Sri Lanka
-
 Sweden
-
 Switzerland
-
 Syria
-
 Taiwan
-
 Tajikistan
-
 Tanzania
-
 Thailand
-
 Trinidad and Tobago
-
 Tunisia
-
 Turkey
-
 UAE
-
 Uganda
-
 Ukraine
-
 United Kingdom
-
United States
-
 Uruguay
-
 Uzbekistan
-
 Venezuela
-
 Vietnam
-
 Yemen
-
 Zambia
-
 Zimbabwe
- Forex
- Crypto












