

Can Telus integration test with space-based network lift AST SpaceMobile stock?

AST SpaceMobile (ASTS) stock is trading at $63.12, reflecting an 8.11% gain on the day. The price is positioned above its short- and medium-term moving averages, with strong upward momentum relative to recent trends.
 34.50
38.11
Highlights
- AST SpaceMobile and Telus successfully completed an integration test for direct-to-device satellite mobile connectivity in Canada, raising expectations for commercial deployment.
- The United States and Japan issued support for AST SpaceMobile's partnership with Rakuten Group, expanding prospects for low Earth orbit satellite infrastructure development.
- AST SpaceMobile stock gained 8.11% to $63.12 with buyers dominating intraday trading; projected range for the next 2 to 3 days is $59.05 to $67.19.
Technical breakthroughs and international support boost commercialization outlook
AST SpaceMobile and Telus have completed the first integration test between Telus' wireless network and AST SpaceMobile's space-based system, demonstrating the practical feasibility of direct-to-device mobile satellite connectivity in Canada, according to Lightreading. This technical breakthrough increases expectations of a near-term commercial launch and supports optimism for new revenue streams. Further momentum comes from a joint statement by the United States and Japan, as reported by Finance Yahoo, which expressed support for AST SpaceMobile's partnership with Japan's Rakuten Group to develop and deploy low Earth orbit satellite infrastructure, broadening potential market opportunities.
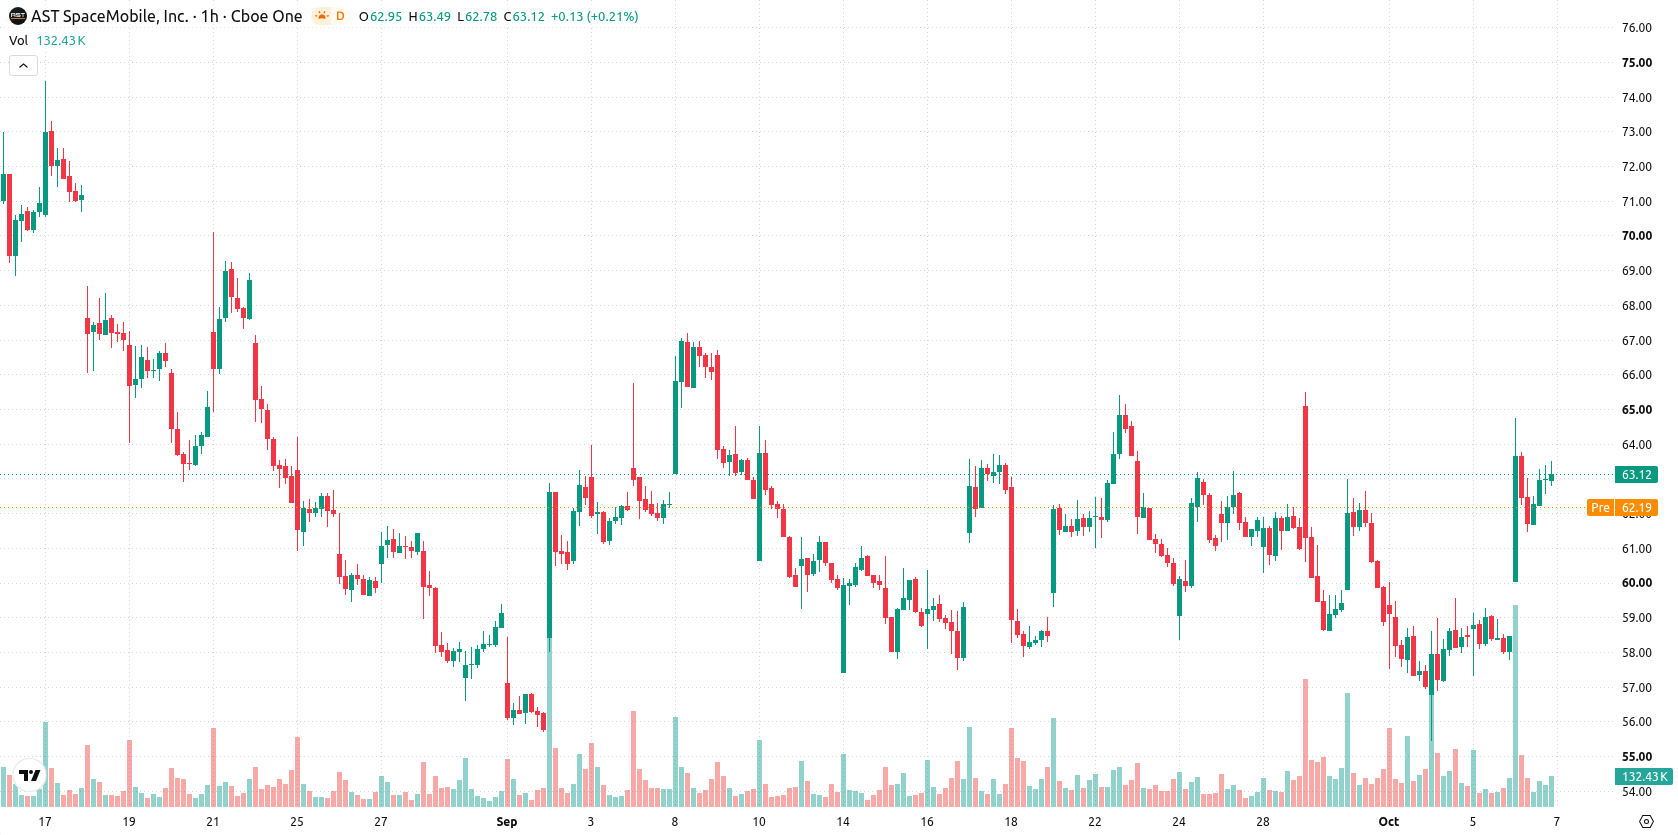
Mixed momentum signals as price nears resistance amid high volatility
On the hourly chart, ASTS trades above its MA-20 at $59.86 and MA-50 at $59.94, but below the long-term MA-200 at $81.05. The Ichimoku Kijun level sits at $60.08, marking immediate support. The expected trading range is defined by support at $59.05 and resistance at $67.19 over the next few days. Momentum indicators are mixed: MACD gives a Buy reading, ADX remains neutral, RSI is at 64.48 in buy territory, while both CCI and Bull/Bear Power suggest overbought conditions. Stoch RSI and the Awesome Oscillator are neutral, and high volatility underscores the current intraday move.
Upside potential gains as consolidation persists above support
In the short term, ASTS is expected to consolidate within the $59.05 to $67.19 band, with a high probability of further upward movement. Should resistance at $67.19 be breached, a continued rally could unfold. Conversely, a break below $59.05 would signal growing reversal risks within the prevailing volatility band.
Earlier, analysts noted that AST SpaceMobile faced persistent technical and legal headwinds, with a prevailing bearish outlook due to ongoing risks. The current technical setup, marked by strong upward momentum above key moving averages and a potential for further gains if resistance at $67.19 is cleared, highlights a shift in near-term risk—making this level critical for traders to monitor amid continued volatility.






Latest AST SpaceMobile News



-
 Afghanistan
-
 Albania
-
 Algeria
-
 Angola
-
 Argentina
-
 Armenia
-
 Australia
-
 Austria
-
 Azerbaijan
-
 Bahamas
-
 Bahrain
-
 Bangladesh
-
 Belarus
-
 Belgium
-
 Bolivia
-
 Botswana
-
 Brazil
-
 Brunei
-
 Bulgaria
-
 Cambodia
-
 Cameroon
-
 Canada
-
 Chile
-
 China
-
 Colombia
-
 Congo
-
 Costa Rica
-
 Cote d'Ivoire
-
 Croatia
-
 Cuba
-
 Cyprus
-
 Czechia
-
 DR Congo
-
 Denmark
-
 Dominican Republic
-
 Ecuador
-
 Egypt
-
 El Salvador
-
 Estonia
-
 Eswatini
-
 Ethiopia
-
 Finland
-
 France
-
 Georgia
-
 Germany
-
 Ghana
-
 Greece
-
 Haiti
-
 Hong Kong
-
 Hungary
-
 India
-
 Indonesia
-
 Iran, Islamic republic
-
 Iraq
-
 Ireland
-
 Israel
-
 Italy
-
 Jamaica
-
 Japan
-
 Jordan
-
 Kazakhstan
-
 Kenya
-
 Korea
-
 Kuwait
-
 Kyrgyzstan
-
 Laos
-
 Latvia
-
 Lebanon
-
 Lesotho
-
 Libya
-
 Lithuania
-
 Luxembourg
-
 Madagascar
-
 Malaysia
-
 Malta
-
 Mauritius
-
 Mexico
-
 Moldova
-
 Mongolia
-
 Montenegro
-
 Morocco
-
 Mozambique
-
 Myanmar
-
 Namibia
-
 Nepal
-
 Netherlands
-
 New Zealand
-
 Nigeria
-
 North Macedonia
-
 Norway
-
 Oman
-
 Pakistan
-
 Palestine
-
 Panama
-
 Papua New Guinea
-
 Paraguay
-
 Peru
-
 Philippines
-
 Poland
-
 Portugal
-
 Puerto Rico
-
 Qatar
-
 Reunion
-
 Romania
-
 Rwanda
-
 Saudi Arabia
-
 Serbia
-
 Singapore
-
 Slovakia
-
 Slovenia
-
 Somalia
-
 South Africa
-
 Spain
-
 Sri Lanka
-
 Sweden
-
 Switzerland
-
 Syria
-
 Taiwan
-
 Tajikistan
-
 Tanzania
-
 Thailand
-
 Trinidad and Tobago
-
 Tunisia
-
 Turkey
-
 UAE
-
 Uganda
-
 Ukraine
-
 United Kingdom
-
United States
-
 Uruguay
-
 Uzbekistan
-
 Venezuela
-
 Vietnam
-
 Yemen
-
 Zambia
-
 Zimbabwe
- Forex
- Crypto












