

Mosaic stock slips below $18.96 support as seller pressure intensifies

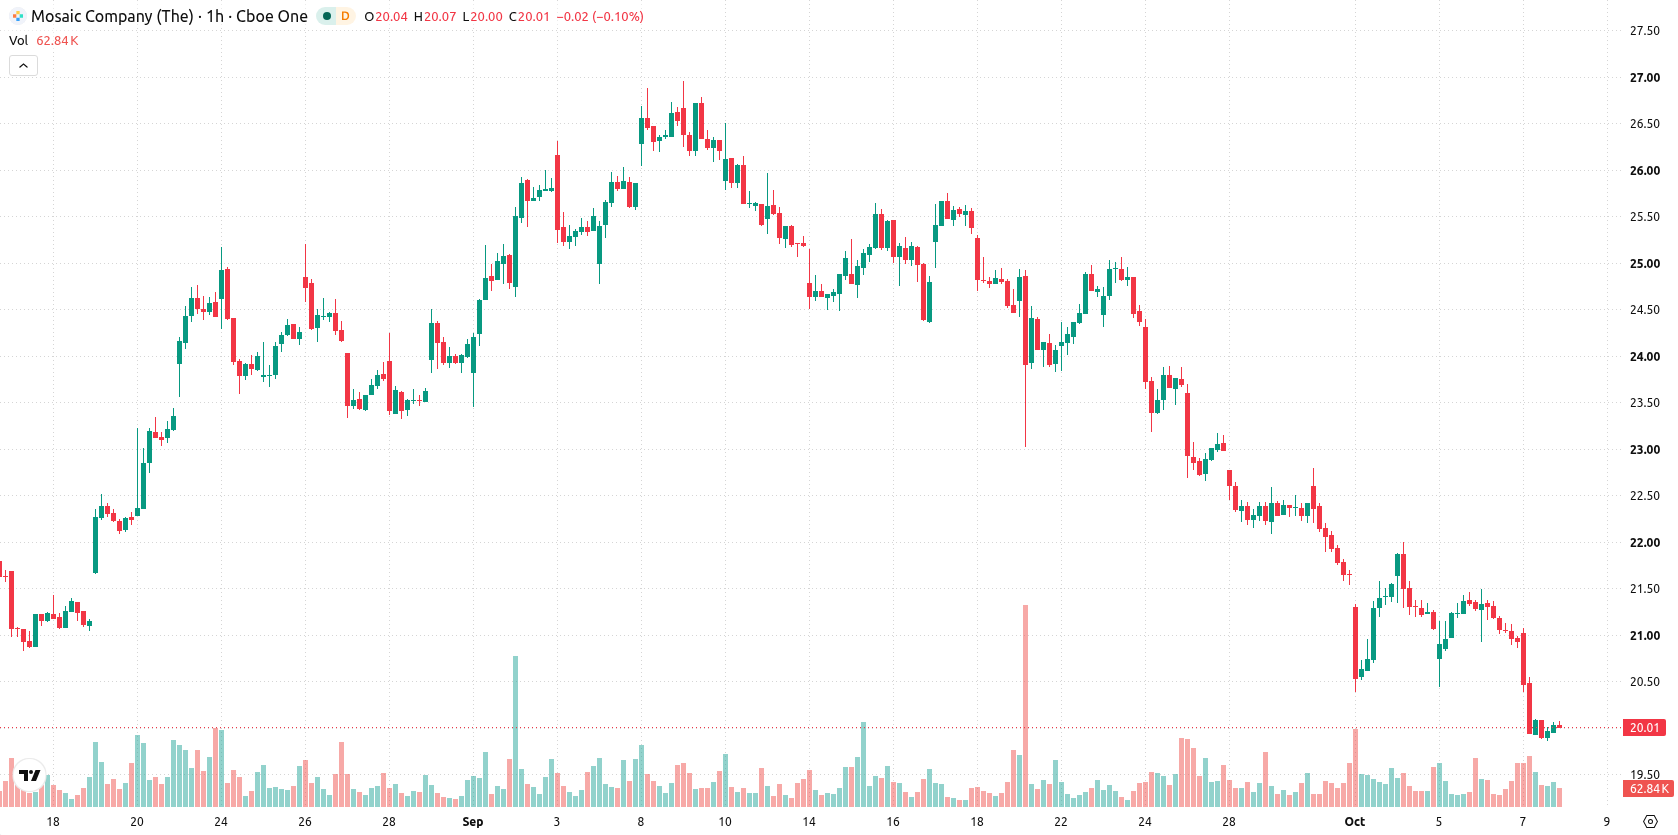
Mosaic (MOS) stock is trading at $19.98, down 4.54% on the day. The price sits below its key moving averages, reflecting persistent negative sentiment and positioning.
 22.80
22.80
Highlights
- Shares of MOS closed at $19.98 after falling 4.54% and remain under persistent downside pressure.
- The stock trades below key moving averages on both short- and long-term charts, indicating a bearish trend.
- Indicators show oversold conditions and strong seller dominance, with the expected price range at $18.96 to $20.69 and downside risk at 75%.
Bearish momentum intensifies below key technical barriers
On the technical side, MOS is trading below its MA-20 at $20.95 and MA-50 at $21.46 on the hourly chart, and remains well beneath the long-term MA-200 at $24.47 on the daily timeframe. The Ichimoku Kijun at $20.93 serves as immediate resistance. Momentum indicators stay decisively bearish, with both MACD and ADX signaling a sell, while RSI sits at just 22.38, and both Stoch RSI and CCI point to oversold territory. Bull/Bear Power confirms continued seller dominance, and the Awesome Oscillator aligns with this prevailing downside momentum.
Trend shift hinges on resistance break amid dominant downside risk
Over the short term, MOS is likely to consolidate within a typical volatility band between $18.96 and $20.69. There is a 25% probability for an upward breakout, while downside risk prevails at 75%. A move above $20.93 would open the door for a potential trend shift to the upside, but if support at $18.96 fails, further losses are likely.
Earlier, analysts noted that Mosaic shares faced pronounced downside risk as technical breakdowns and persistent oversold signals weighed on the stock's outlook. The latest data corroborate this bearish view, with continued momentum weakness making the $18.96 support level a critical gauge for the next potential move.






Latest The Mosaic Company News




-
 Afghanistan
-
 Albania
-
 Algeria
-
 Angola
-
 Argentina
-
 Armenia
-
 Australia
-
 Austria
-
 Azerbaijan
-
 Bahamas
-
 Bahrain
-
 Bangladesh
-
 Belarus
-
 Belgium
-
 Bolivia
-
 Botswana
-
 Brazil
-
 Brunei
-
 Bulgaria
-
 Cambodia
-
 Cameroon
-
 Canada
-
 Chile
-
 China
-
 Colombia
-
 Congo
-
 Costa Rica
-
 Cote d'Ivoire
-
 Croatia
-
 Cuba
-
 Cyprus
-
 Czechia
-
 DR Congo
-
 Denmark
-
 Dominican Republic
-
 Ecuador
-
 Egypt
-
 El Salvador
-
 Estonia
-
 Eswatini
-
 Ethiopia
-
 Finland
-
 France
-
 Georgia
-
 Germany
-
 Ghana
-
 Greece
-
 Haiti
-
 Hong Kong
-
 Hungary
-
 India
-
 Indonesia
-
 Iran, Islamic republic
-
 Iraq
-
 Ireland
-
 Israel
-
 Italy
-
 Jamaica
-
 Japan
-
 Jordan
-
 Kazakhstan
-
 Kenya
-
 Korea
-
 Kuwait
-
 Kyrgyzstan
-
 Laos
-
 Latvia
-
 Lebanon
-
 Lesotho
-
 Libya
-
 Lithuania
-
 Luxembourg
-
 Madagascar
-
 Malaysia
-
 Malta
-
 Mauritius
-
 Mexico
-
 Moldova
-
 Mongolia
-
 Montenegro
-
 Morocco
-
 Mozambique
-
 Myanmar
-
 Namibia
-
 Nepal
-
 Netherlands
-
 New Zealand
-
 Nigeria
-
 North Macedonia
-
 Norway
-
 Oman
-
 Pakistan
-
 Palestine
-
 Panama
-
 Papua New Guinea
-
 Paraguay
-
 Peru
-
 Philippines
-
 Poland
-
 Portugal
-
 Puerto Rico
-
 Qatar
-
 Reunion
-
 Romania
-
 Rwanda
-
 Saudi Arabia
-
 Serbia
-
 Singapore
-
 Slovakia
-
 Slovenia
-
 Somalia
-
 South Africa
-
 Spain
-
 Sri Lanka
-
 Sweden
-
 Switzerland
-
 Syria
-
 Taiwan
-
 Tajikistan
-
 Tanzania
-
 Thailand
-
 Trinidad and Tobago
-
 Tunisia
-
 Turkey
-
 UAE
-
 Uganda
-
 Ukraine
-
 United Kingdom
-
United States
-
 Uruguay
-
 Uzbekistan
-
 Venezuela
-
 Vietnam
-
 Yemen
-
 Zambia
-
 Zimbabwe
- Forex
- Crypto












