

Disney stock weekly forecast: Streaming-driven restructuring supports gains as price holds near $105.29 support

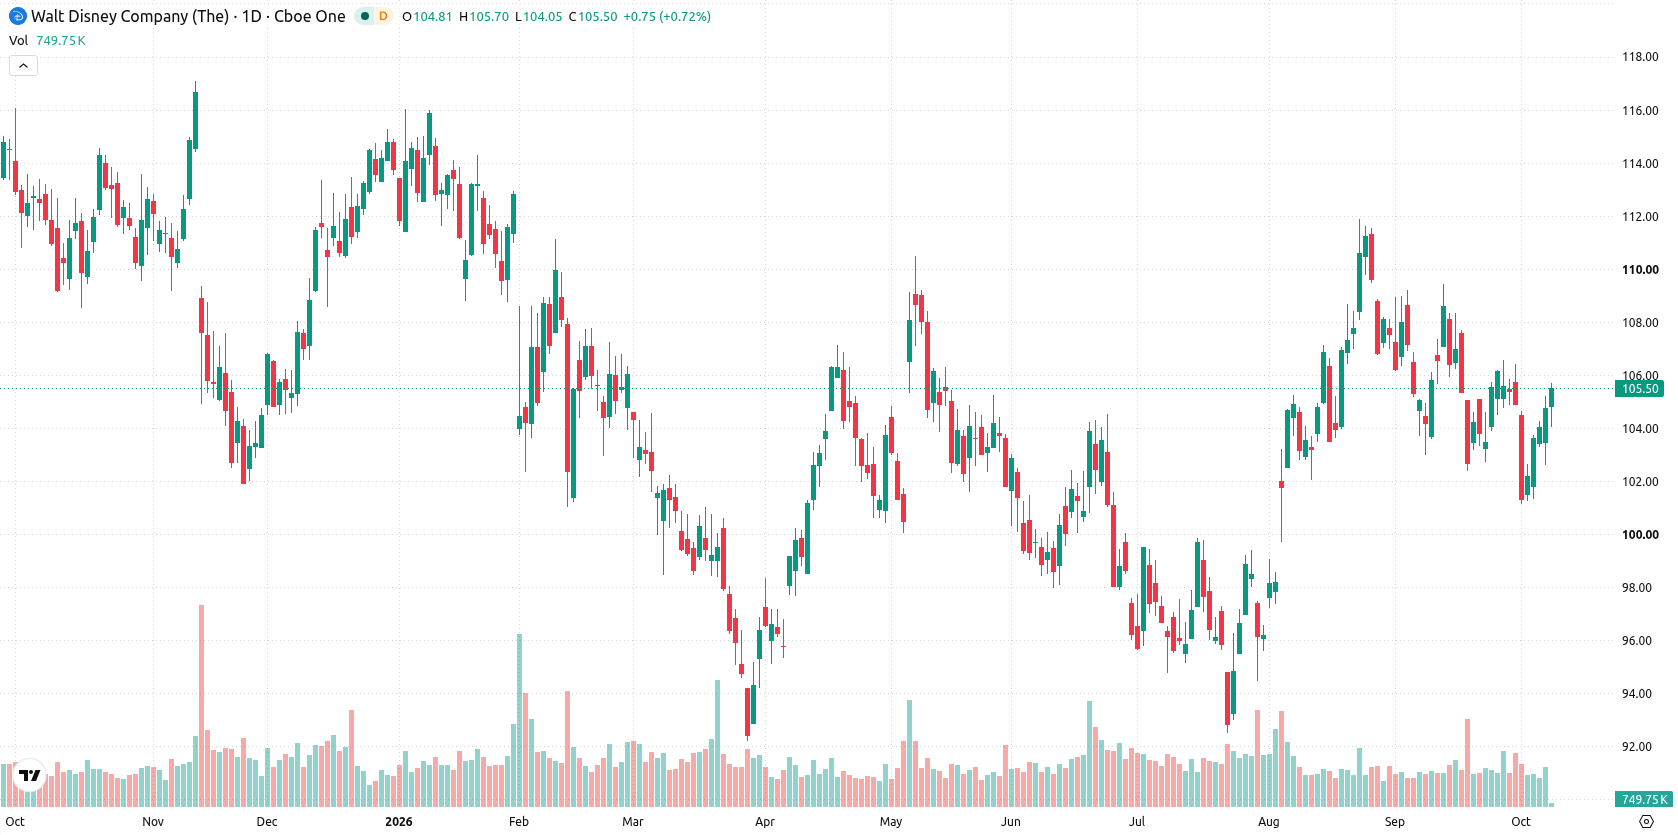
Shares of The Walt Disney Company (DIS) are trading near $106 after a rally of roughly 3% over the past week as buyers paused with short-term signals entering overbought territory. Disney's recent structural changes served as the key catalyst, but momentum is now flagging with consolidation likely ahead.
 111.88
112.30
Highlights
- Shares of Disney gained $3.49 over the past week to close at $105.69, ending the week at the top of the recent trading range.
- The stock remains in a bullish long-term structure as it trades above its 20-, 50-, and 200-day moving averages.
- Key technical signals are mixed with price consolidating between $105.29 and $107.38, and a 68% probability of upside within a projected range of $103.99 to $107.38 next week.
Operational overhaul drives investor flows and positive ETF sentiment this week
Disney began a significant restructuring of its television division last week, resulting in hundreds of job cuts and early retirement offers to executives, as reported by the Wall Street Journal and the Los Angeles Times. The overhaul, part of the 'One Disney' initiative, is designed to consolidate operations and shift television focus toward streaming audiences. ETF flows showed consecutive days of net buying, including a $44.5 million purchase on October 5, according to GuruFocus.
Momentum indicators diverge as price consolidates at key technical support
On the daily chart, the setup shows a contained move within a narrow range as volatility comes in at 3.75%. Key momentum signals diverge, with the MACD in sell territory at -0.53 while the Stochastic RSI sits in the overbought zone at 82.52. Price is currently holding at support on the Ichimoku Kijun at $105.29. With no clear resistance overhead and momentum mixed, consolidation within the current band is likely for now.
Upside bias persists next week if resistance is cleared above the current range
Next week, the expected range is $103.99 to $107.38, with a 68% probability of an increase and a 32% chance of decline. The base case sees Disney stock trading between the Kijun support at $105.29 and potential resistance near the upper bound of $107.38. A bullish break above $107.38 would open the door to further upside, while a dip below $105.29 could trigger a move toward the lower end of the projected range at $103.99.
Earlier, analysts noted that Disney remained a multi-year earnings compounder, with potential for further growth driven by business momentum and ongoing investment in products and experiences. The current focus on restructuring and operational consolidation adds a new dimension to the outlook, with price action suggesting a key level to watch at $105.29 as traders monitor for a breakout or downside risk into next week’s projected range.











-
 Afghanistan
-
 Albania
-
 Algeria
-
 Angola
-
 Argentina
-
 Armenia
-
 Australia
-
 Austria
-
 Azerbaijan
-
 Bahamas
-
 Bahrain
-
 Bangladesh
-
 Belarus
-
 Belgium
-
 Bolivia
-
 Botswana
-
 Brazil
-
 Brunei
-
 Bulgaria
-
 Cambodia
-
 Cameroon
-
 Canada
-
 Chile
-
 China
-
 Colombia
-
 Congo
-
 Costa Rica
-
 Cote d'Ivoire
-
 Croatia
-
 Cuba
-
 Cyprus
-
 Czechia
-
 DR Congo
-
 Denmark
-
 Dominican Republic
-
 Ecuador
-
 Egypt
-
 El Salvador
-
 Estonia
-
 Eswatini
-
 Ethiopia
-
 Finland
-
 France
-
 Georgia
-
 Germany
-
 Ghana
-
 Greece
-
 Haiti
-
 Hong Kong
-
 Hungary
-
 India
-
 Indonesia
-
 Iran, Islamic republic
-
 Iraq
-
 Ireland
-
 Israel
-
 Italy
-
 Jamaica
-
 Japan
-
 Jordan
-
 Kazakhstan
-
 Kenya
-
 Korea
-
 Kuwait
-
 Kyrgyzstan
-
 Laos
-
 Latvia
-
 Lebanon
-
 Lesotho
-
 Libya
-
 Lithuania
-
 Luxembourg
-
 Madagascar
-
 Malaysia
-
 Malta
-
 Mauritius
-
 Mexico
-
 Moldova
-
 Mongolia
-
 Montenegro
-
 Morocco
-
 Mozambique
-
 Myanmar
-
 Namibia
-
 Nepal
-
 Netherlands
-
 New Zealand
-
 Nigeria
-
 North Macedonia
-
 Norway
-
 Oman
-
 Pakistan
-
 Palestine
-
 Panama
-
 Papua New Guinea
-
 Paraguay
-
 Peru
-
 Philippines
-
 Poland
-
 Portugal
-
 Puerto Rico
-
 Qatar
-
 Reunion
-
 Romania
-
 Rwanda
-
 Saudi Arabia
-
 Serbia
-
 Singapore
-
 Slovakia
-
 Slovenia
-
 Somalia
-
 South Africa
-
 Spain
-
 Sri Lanka
-
 Sweden
-
 Switzerland
-
 Syria
-
 Taiwan
-
 Tajikistan
-
 Tanzania
-
 Thailand
-
 Trinidad and Tobago
-
 Tunisia
-
 Turkey
-
 UAE
-
 Uganda
-
 Ukraine
-
 United Kingdom
-
United States
-
 Uruguay
-
 Uzbekistan
-
 Venezuela
-
 Vietnam
-
 Yemen
-
 Zambia
-
 Zimbabwe
- Forex
- Crypto












