

Occidental Petroleum stock rises amid expansion into carbon management business

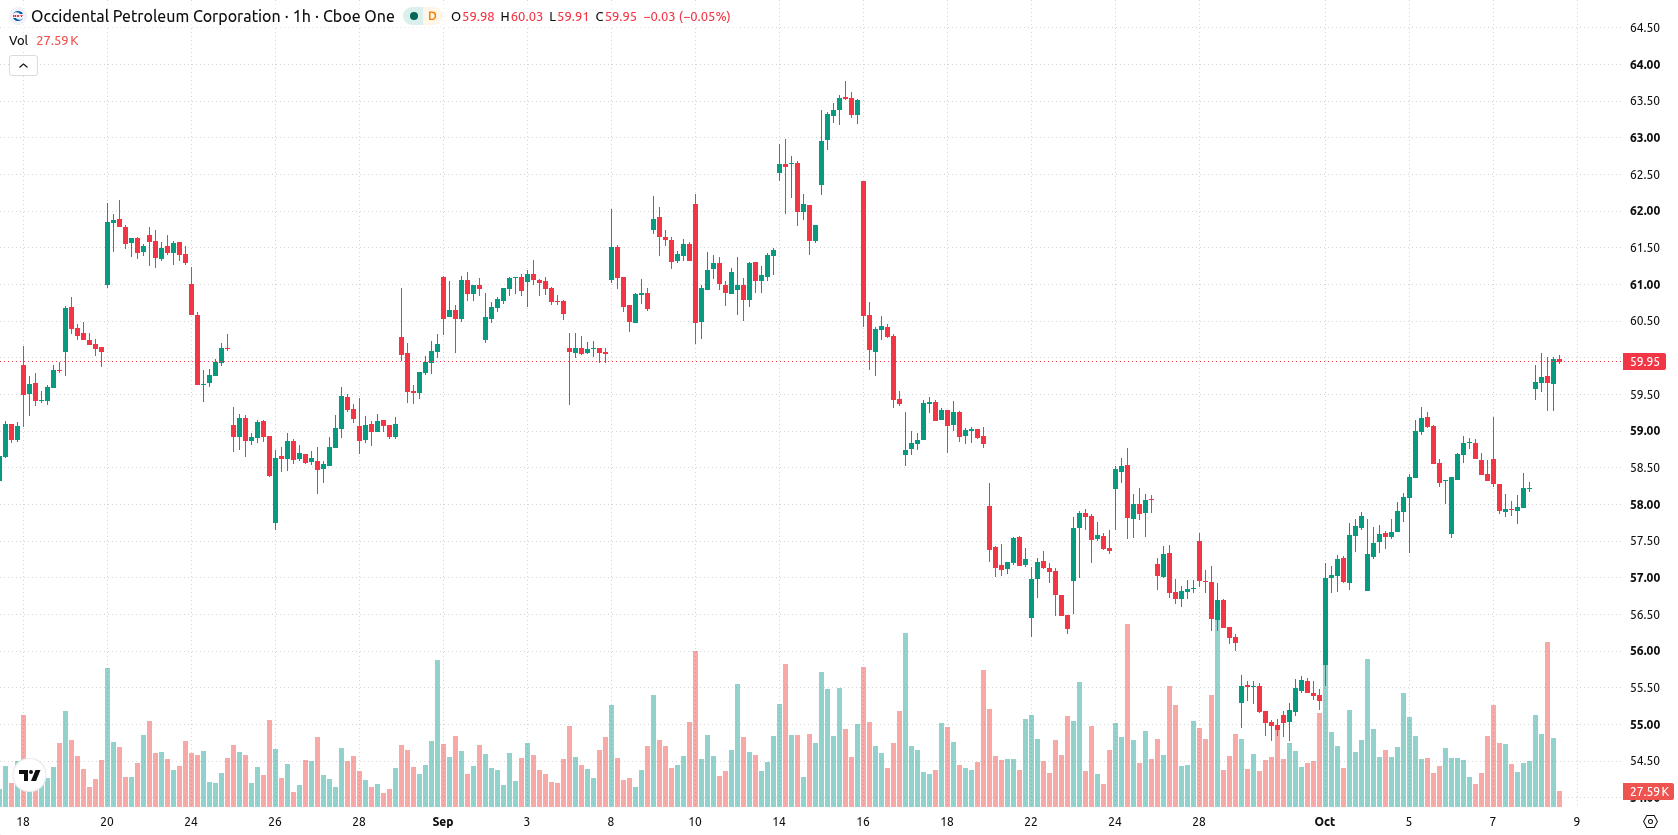
Occidental Petroleum (OXY) stock is trading at $59.97 after climbing 3.02% on the day, marking a strong upward move. The price action places OXY above its key moving averages, indicating robust short-term and longer-term momentum.
 58.97
58.98
Highlights
- Occidental Petroleum operates as a major large-cap energy producer with scale in the Permian Basin and global assets, supporting strong cash flow generation.
- Expansion into carbon management adds future revenue diversification and positions Occidental Petroleum for tighter environmental regulation.
- Shares of Occidental Petroleum trade in a bullish structure with robust upward pressure, expected to remain in the $58.87 to $61.77 range in the short term.
Cash flow strength and carbon strategy elevate outlook amid high oil prices
Occidental Petroleum is positioned as a major large-cap energy producer with significant assets in the Permian Basin and globally, providing operational scale that enables robust cash flow generation and operational resilience, according to Simplywall. Its active expansion into carbon management diversifies future revenue streams and positions the company advantageously for stricter regulation and sustainability initiatives. High oil prices above $90 per barrel further strengthen Occidental's financial profile by boosting upstream margins and capital returns, shaping the overall constructive outlook for the company.
Overbought momentum emerges as technicals breach major supports
Looking at specific technicals, OXY trades well above the MA-20 at $58.51 and MA-50 at $57.4 on the hourly chart, while also holding above its daily MA-200 at $54.3. The Ichimoku Kijun sits at $58.69, acting as immediate support. Momentum signals provide mixed signals: MACD is in a buy configuration, while ADX remains neutral, reflecting a lack of a firmly established trend. RSI is in buy territory at 73.91, but Stochastic RSI, CCI, and Bull/Bear Power are all overbought, confirming strong buying pressure yet flagging the risk of short-term excess. The Awesome Oscillator reads neutral.
High rally probability as volatility range constrains reversal risk
In the short term, OXY is expected to move within a $58.87–$61.77 volatility band relative to current levels. The probability of continued upward movement is very high, with a low likelihood of a reversal. The base case sees price consolidating within this corridor, while a break above resistance could trigger new highs; alternatively, a bearish break below immediate support would turn focus toward recent support levels.
Previously, analysts noted that Occidental Petroleum was consolidating within a defined range amid mixed technical signals and ongoing supply-driven headwinds. With the latest breakout and reinforced momentum above key moving averages, traders should now monitor for a potential continuation toward new highs, while remaining alert to any reversal below the immediate support level.






Latest Occidental Petroleum News


-
 Afghanistan
-
 Albania
-
 Algeria
-
 Angola
-
 Argentina
-
 Armenia
-
 Australia
-
 Austria
-
 Azerbaijan
-
 Bahamas
-
 Bahrain
-
 Bangladesh
-
 Belarus
-
 Belgium
-
 Bolivia
-
 Botswana
-
 Brazil
-
 Brunei
-
 Bulgaria
-
 Cambodia
-
 Cameroon
-
 Canada
-
 Chile
-
 China
-
 Colombia
-
 Congo
-
 Costa Rica
-
 Cote d'Ivoire
-
 Croatia
-
 Cuba
-
 Cyprus
-
 Czechia
-
 DR Congo
-
 Denmark
-
 Dominican Republic
-
 Ecuador
-
 Egypt
-
 El Salvador
-
 Estonia
-
 Eswatini
-
 Ethiopia
-
 Finland
-
 France
-
 Georgia
-
 Germany
-
 Ghana
-
 Greece
-
 Haiti
-
 Hong Kong
-
 Hungary
-
 India
-
 Indonesia
-
 Iran, Islamic republic
-
 Iraq
-
 Ireland
-
 Israel
-
 Italy
-
 Jamaica
-
 Japan
-
 Jordan
-
 Kazakhstan
-
 Kenya
-
 Korea
-
 Kuwait
-
 Kyrgyzstan
-
 Laos
-
 Latvia
-
 Lebanon
-
 Lesotho
-
 Libya
-
 Lithuania
-
 Luxembourg
-
 Madagascar
-
 Malaysia
-
 Malta
-
 Mauritius
-
 Mexico
-
 Moldova
-
 Mongolia
-
 Montenegro
-
 Morocco
-
 Mozambique
-
 Myanmar
-
 Namibia
-
 Nepal
-
 Netherlands
-
 New Zealand
-
 Nigeria
-
 North Macedonia
-
 Norway
-
 Oman
-
 Pakistan
-
 Palestine
-
 Panama
-
 Papua New Guinea
-
 Paraguay
-
 Peru
-
 Philippines
-
 Poland
-
 Portugal
-
 Puerto Rico
-
 Qatar
-
 Reunion
-
 Romania
-
 Rwanda
-
 Saudi Arabia
-
 Serbia
-
 Singapore
-
 Slovakia
-
 Slovenia
-
 Somalia
-
 South Africa
-
 Spain
-
 Sri Lanka
-
 Sweden
-
 Switzerland
-
 Syria
-
 Taiwan
-
 Tajikistan
-
 Tanzania
-
 Thailand
-
 Trinidad and Tobago
-
 Tunisia
-
 Turkey
-
 UAE
-
 Uganda
-
 Ukraine
-
 United Kingdom
-
United States
-
 Uruguay
-
 Uzbekistan
-
 Venezuela
-
 Vietnam
-
 Yemen
-
 Zambia
-
 Zimbabwe
- Forex
- Crypto












