

BTBT drops as sellers dominate short-term trend

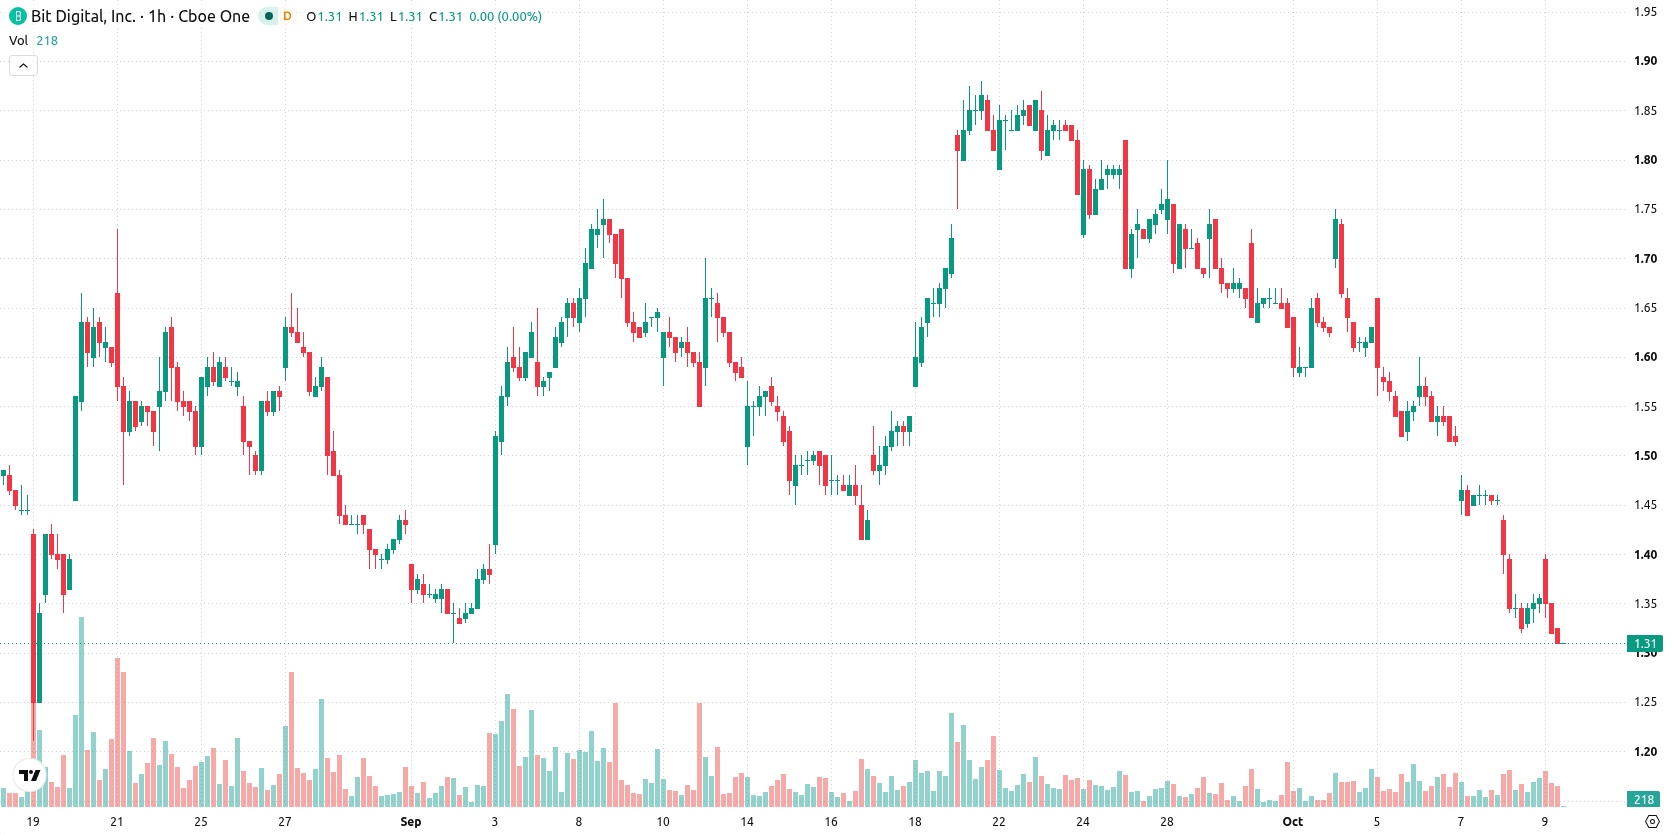
Bit Digital (BTBT) stock is trading at $1.31 following a daily decline of 3.02%. The price sits below its key moving averages, highlighting ongoing downward momentum.
 0.7593
0.8749
Highlights
- BTBT/USD trades below key moving averages on both hourly and daily charts, confirming broad bearish momentum.
- Momentum indicators, including MACD and ADX, show persistent selling pressure with oversold conditions and high volatility.
- Expected price range is $1.16 to $1.46 in coming days, with further downside likely unless a breakout above $1.46 occurs.
Oversold signals and resistance cap further downside risk
On the H1 timeframe, BTBT is trading below its MA-20 and MA-50, while on the daily chart it remains under the MA-200. The Ichimoku Kijun at $1.46 serves as immediate resistance. Momentum indicators are firmly negative, as both MACD and ADX indicate a sell bias. RSI, at 27.29, and CCI both signal strong oversold conditions, while Stochastic RSI is neutral. Bull/Bear Power reflects pronounced intraday selling pressure, and the Awesome Oscillator reads as neutral, not contributing to a directional view.
Rebound unlikely as volatility defines range and downside threat
In the near term, BTBT is expected to consolidate within a range of $1.16 to $1.46, reflecting present volatility. A bullish scenario could emerge only if the price breaks decisively above the $1.46 resistance, potentially signaling an early-stage recovery. Should the price fall below $1.16, strong downside risk persists, opening the way for new lows. The probability of a rebound remains low under current market conditions.
Earlier, analysts noted that Bit Digital continued to face significant bearish momentum, with technical signals indicating elevated downside risks. The current analysis reinforces this view as persistent negative momentum and deep oversold readings suggest traders should monitor the $1.16 support for potential breakdown risk in the sessions ahead.






Latest Bit Digital News



-
 Afghanistan
-
 Albania
-
 Algeria
-
 Angola
-
 Argentina
-
 Armenia
-
 Australia
-
 Austria
-
 Azerbaijan
-
 Bahamas
-
 Bahrain
-
 Bangladesh
-
 Belarus
-
 Belgium
-
 Bolivia
-
 Botswana
-
 Brazil
-
 Brunei
-
 Bulgaria
-
 Cambodia
-
 Cameroon
-
 Canada
-
 Chile
-
 China
-
 Colombia
-
 Congo
-
 Costa Rica
-
 Cote d'Ivoire
-
 Croatia
-
 Cuba
-
 Cyprus
-
 Czechia
-
 DR Congo
-
 Denmark
-
 Dominican Republic
-
 Ecuador
-
 Egypt
-
 El Salvador
-
 Estonia
-
 Eswatini
-
 Ethiopia
-
 Finland
-
 France
-
 Georgia
-
 Germany
-
 Ghana
-
 Greece
-
 Haiti
-
 Hong Kong
-
 Hungary
-
 India
-
 Indonesia
-
 Iran, Islamic republic
-
 Iraq
-
 Ireland
-
 Israel
-
 Italy
-
 Jamaica
-
 Japan
-
 Jordan
-
 Kazakhstan
-
 Kenya
-
 Korea
-
 Kuwait
-
 Kyrgyzstan
-
 Laos
-
 Latvia
-
 Lebanon
-
 Lesotho
-
 Libya
-
 Lithuania
-
 Luxembourg
-
 Madagascar
-
 Malaysia
-
 Malta
-
 Mauritius
-
 Mexico
-
 Moldova
-
 Mongolia
-
 Montenegro
-
 Morocco
-
 Mozambique
-
 Myanmar
-
 Namibia
-
 Nepal
-
 Netherlands
-
 New Zealand
-
 Nigeria
-
 North Macedonia
-
 Norway
-
 Oman
-
 Pakistan
-
 Palestine
-
 Panama
-
 Papua New Guinea
-
 Paraguay
-
 Peru
-
 Philippines
-
 Poland
-
 Portugal
-
 Puerto Rico
-
 Qatar
-
 Reunion
-
 Romania
-
 Rwanda
-
 Saudi Arabia
-
 Serbia
-
 Singapore
-
 Slovakia
-
 Slovenia
-
 Somalia
-
 South Africa
-
 Spain
-
 Sri Lanka
-
 Sweden
-
 Switzerland
-
 Syria
-
 Taiwan
-
 Tajikistan
-
 Tanzania
-
 Thailand
-
 Trinidad and Tobago
-
 Tunisia
-
 Turkey
-
 UAE
-
 Uganda
-
 Ukraine
-
 United Kingdom
-
United States
-
 Uruguay
-
 Uzbekistan
-
 Venezuela
-
 Vietnam
-
 Yemen
-
 Zambia
-
 Zimbabwe
- Forex
- Crypto












