

JPMorgan Chase shares hold near $333.71 support as technical signals remain mixed: weekly analysis

JPMorgan Chase & Co. (JPM) stock is trading near $335 after a week where support levels have come into focus following a stretched decline. The daily chart reflects mixed momentum signals and lingering caution, as shares hover near support and await direction ahead of the next key catalyst.
 335.21
335.21
335.21
Highlights
- Shares of JPMorgan Chase edged up to $334.87 but remain below key short-term moving averages, signaling ongoing consolidation.
- Momentum indicators are mixed with the stock near oversold territory and trend strength registering as weak.
- Next week projects a trading range of $323.99 to $338.71, with a 62% chance of a move lower if $333.71 support fails.
Dividend hike and buyback drive sentiment as earnings approach
JPM is scheduled to release third-quarter 2026 earnings on October 13, with analyst expectations centering on earnings per share of around $5.93 to $5.94 and revenue between $51.20 billion and $52.21 billion. Recent reports highlight that JPM remains a bellwether for the start of U.S. bank earnings season, with attention on trading, lending activity, and overall fee strength. The firm also boosted its quarterly dividend by 10% to $1.65 and announced a new $50 billion share buyback program, reinforcing its capital strength ahead of earnings.
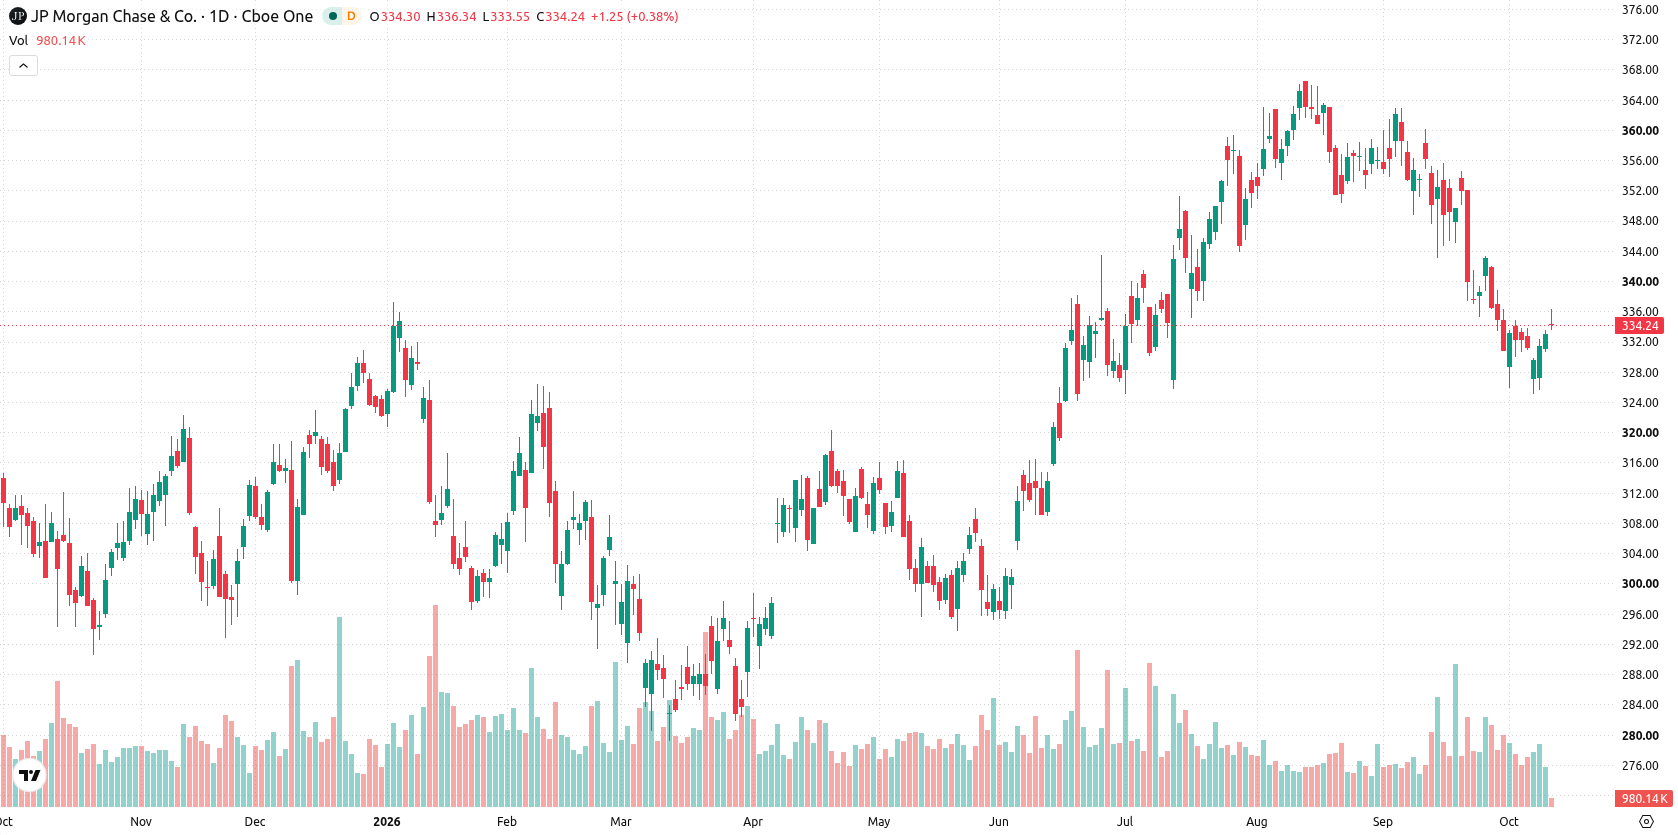
Mixed signals persist as RSI approaches oversold and price hugs support
On the daily chart, JPMorgan Chase stock is holding at nearby support at $333.71, with resistance from the 20-day moving average at $339.41 and an overhead Ichimoku Kijun at $343.96. Daily momentum signals are somewhat mixed: the RSI stands at 38.42, approaching oversold territory, and the ADX at 20.48 also points to lackluster trend strength, while volatility over the past week registers at 2.65%. The momentum character reflects an emerging move higher that is not yet confirmed, as MACD and ADX suggest caution, while price action remains tightly bound to local levels.
Breakout risk looms as range narrows into next week’s forecast
Next week, the expected range is $323.99 to $338.71, with a 38% probability of an increase and 62% chance of a decrease. The base case envisions shares holding between $333.71 support and $339.41 resistance. A bullish turn would require a decisive break above $339.41, targeting higher toward the Ichimoku Kijun. If support at $333.71 fails, renewed weakness toward $323.99 is likely.
Earlier, analysts noted that JPMorgan's earnings results tend to act as a catalyst for the broader financial sector, with options pricing reflecting expectations for significant post-report volatility. With mixed technical momentum signals and a decisive catalyst approaching, traders should closely monitor whether price action pushes shares above the $339.41 resistance to confirm an emerging bullish reversal.





Latest JPMorgan Chase News



-
 Afghanistan
-
 Albania
-
 Algeria
-
 Angola
-
 Argentina
-
 Armenia
-
 Australia
-
 Austria
-
 Azerbaijan
-
 Bahamas
-
 Bahrain
-
 Bangladesh
-
 Belarus
-
 Belgium
-
 Bolivia
-
 Botswana
-
 Brazil
-
 Brunei
-
 Bulgaria
-
 Cambodia
-
 Cameroon
-
 Canada
-
 Chile
Chile
-
 China
China
-
 Colombia
-
 Congo
Congo
-
 Costa Rica
-
 Cote d'Ivoire
-
 Croatia
-
 Cuba
Cuba
-
 Cyprus
-
 Czechia
-
 DR Congo
-
 Denmark
-
 Dominican Republic
-
 Ecuador
-
 Egypt
Egypt
-
 El Salvador
-
 Estonia
-
 Eswatini
-
 Ethiopia
-
 Finland
-
 France
-
 Georgia
-
 Germany
-
 Ghana
Ghana
-
 Greece
-
 Haiti
Haiti
-
 Hong Kong
-
 Hungary
-
 India
India
-
 Indonesia
-
 Iran, Islamic republic
-
 Iraq
Iraq
-
 Ireland
-
 Israel
-
 Italy
Italy
-
 Jamaica
-
 Japan
Japan
-
 Jordan
-
 Kazakhstan
-
 Kenya
Kenya
-
 Korea
Korea
-
 Kuwait
-
 Kyrgyzstan
-
 Laos
Laos
-
 Latvia
-
 Lebanon
-
 Lesotho
-
 Libya
Libya
-
 Lithuania
-
 Luxembourg
-
 Madagascar
-
 Malaysia
-
 Malta
Malta
-
 Mauritius
-
 Mexico
-
 Moldova
-
 Mongolia
-
 Montenegro
-
 Morocco
-
 Mozambique
-
 Myanmar
-
 Namibia
-
 Nepal
Nepal
-
 Netherlands
-
 New Zealand
-
 Nigeria
-
 North Macedonia
-
 Norway
-
 Oman
Oman
-
 Pakistan
-
 Palestine
-
 Panama
-
 Papua New Guinea
-
 Paraguay
-
 Peru
Peru
-
 Philippines
-
 Poland
-
 Portugal
-
 Puerto Rico
-
 Qatar
Qatar
-
 Reunion
-
 Romania
-
 Rwanda
-
 Saudi Arabia
-
 Serbia
-
 Singapore
-
 Slovakia
-
 Slovenia
-
 Somalia
-
 South Africa
-
 Spain
Spain
-
 Sri Lanka
-
 Sweden
-
 Switzerland
-
 Syria
Syria
-
 Taiwan
-
 Tajikistan
-
 Tanzania
-
 Thailand
-
 Trinidad and Tobago
-
 Tunisia
-
 Turkey
-
 UAE
UAE
-
 Uganda
-
 Ukraine
-
 United Kingdom
-
United States
-
 Uruguay
-
 Uzbekistan
-
 Venezuela
-
 Vietnam
-
 Yemen
Yemen
-
 Zambia
-
 Zimbabwe
- Forex
- Crypto












