


Zillow Group (ZG) extended its decline by 3.41% today as seller pressure intensified, even as questions continued over whether the company’s current valuation matches its earnings in an environment of slowing pending home sales. The move is supported by the stock remaining below its 20-day, 50-day, and 200-day moving averages, pointing to a persistent bearish structure.
 29.82
30.08
29.82
30.08
Highlights
- Zillow continues to dominate residential real estate search activity for buyers, sellers, and renters despite slowing pending home sales.
- Investors continue to question Zillow stock’s valuation in relation to the company’s current earnings given market headwinds.
- Shares of Zillow trade below key moving averages, with strong selling pressure and a projected five-day range of $27.61 to $30.11.
Investor skepticism persists amid slowing home sales and muted corporate news
Zillow remains central to residential real estate search activity for buyers, sellers, and renters. Investors have questioned whether the company’s valuation is aligned with its current level of earnings given the current environment of slowing pending home sales. No major new product launches, regulatory updates, or other significant corporate events were reported.
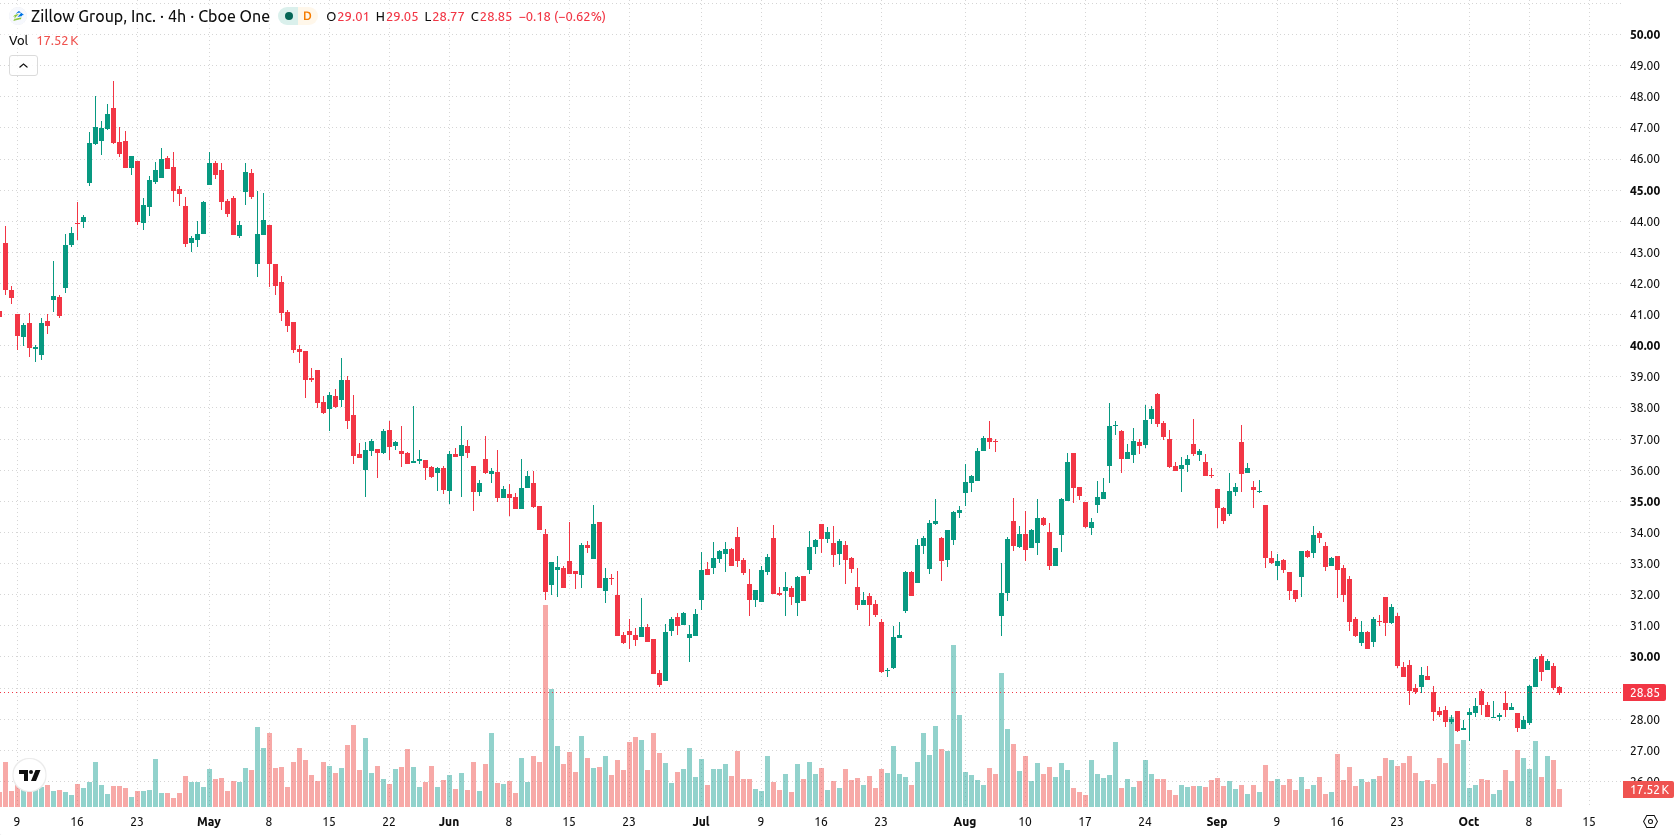
Bearish trend established as momentum weakens and buyers surface intraday
Zillow is trading below its 20-day, 50-day, and 200-day moving averages ($29.74, $33.05, $41.84), indicating persistent seller pressure across short, medium, and long-term trends. The near-term ceiling stands at $29.74, with support set by the day’s low at $28.78, and the overall alignment of the 50-day versus the 200-day moving averages is bearish. Momentum indicators are broadly negative, with the MACD at -1.4 signaling strong selling and the ADX at a subdued 14.4 pointing to weak trend strength. The RSI of 46.63 leans toward a sell signal, while the Stochastic RSI is very elevated at 99.21 and the Bull/Bear Power (BBP) at 0.91 signals buyer dominance, both in overbought territory. CCI and Awesome Oscillator are neutral, highlighting a divergence as intraday buyers are active despite bearish momentum. The stock last traded at $28.86 after opening with a downside gap of about 0.8% and is now near the session low after slipping 3.41% today, with intraday volatility at 3.61%. The tone remains pressured after the open.
Previously it was reported that the U.S. Supreme Court declined to review Zillow's appeal allowing a securities class action tied to the collapse of its home-flipping business to proceed. Against this backdrop, traders should closely monitor the $29.74 resistance and $28.78 support, as a break in either direction could set the tone for near-term volatility in Zillow's shares.





Latest Zillow Group News






-
 Afghanistan
-
 Albania
-
 Algeria
-
 Angola
-
 Argentina
-
 Armenia
-
 Australia
-
 Austria
-
 Azerbaijan
-
 Bahamas
-
 Bahrain
-
 Bangladesh
-
 Belarus
-
 Belgium
-
 Bolivia
-
 Botswana
-
 Brazil
-
 Brunei
-
 Bulgaria
-
 Cambodia
-
 Cameroon
-
 Canada
-
 Chile
Chile
-
 China
China
-
 Colombia
-
 Congo
Congo
-
 Costa Rica
-
 Cote d'Ivoire
-
 Croatia
-
 Cuba
Cuba
-
 Cyprus
-
 Czechia
-
 DR Congo
-
 Denmark
-
 Dominican Republic
-
 Ecuador
-
 Egypt
Egypt
-
 El Salvador
-
 Estonia
-
 Eswatini
-
 Ethiopia
-
 Finland
-
 France
-
 Georgia
-
 Germany
-
 Ghana
Ghana
-
 Greece
-
 Haiti
Haiti
-
 Hong Kong
-
 Hungary
-
 India
India
-
 Indonesia
-
 Iran, Islamic republic
-
 Iraq
Iraq
-
 Ireland
-
 Israel
-
 Italy
Italy
-
 Jamaica
-
 Japan
Japan
-
 Jordan
-
 Kazakhstan
-
 Kenya
Kenya
-
 Korea
Korea
-
 Kuwait
-
 Kyrgyzstan
-
 Laos
Laos
-
 Latvia
-
 Lebanon
-
 Lesotho
-
 Libya
Libya
-
 Lithuania
-
 Luxembourg
-
 Madagascar
-
 Malaysia
-
 Malta
Malta
-
 Mauritius
-
 Mexico
-
 Moldova
-
 Mongolia
-
 Montenegro
-
 Morocco
-
 Mozambique
-
 Myanmar
-
 Namibia
-
 Nepal
Nepal
-
 Netherlands
-
 New Zealand
-
 Nigeria
-
 North Macedonia
-
 Norway
-
 Oman
Oman
-
 Pakistan
-
 Palestine
-
 Panama
-
 Papua New Guinea
-
 Paraguay
-
 Peru
Peru
-
 Philippines
-
 Poland
-
 Portugal
-
 Puerto Rico
-
 Qatar
Qatar
-
 Reunion
-
 Romania
-
 Rwanda
-
 Saudi Arabia
-
 Serbia
-
 Singapore
-
 Slovakia
-
 Slovenia
-
 Somalia
-
 South Africa
-
 Spain
Spain
-
 Sri Lanka
-
 Sweden
-
 Switzerland
-
 Syria
Syria
-
 Taiwan
-
 Tajikistan
-
 Tanzania
-
 Thailand
-
 Trinidad and Tobago
-
 Tunisia
-
 Turkey
-
 UAE
UAE
-
 Uganda
-
 Ukraine
-
 United Kingdom
-
United States
-
 Uruguay
-
 Uzbekistan
-
 Venezuela
-
 Vietnam
-
 Yemen
Yemen
-
 Zambia
-
 Zimbabwe
- Forex
- Crypto












